


2021 Q2 Review
Quarterly review of results, the market, portfolio companies, and insights

Results
The second quarter of 2021 ended on June 30th, 2021.
For the second quarter, the consolidated return for Torre Financial accounts was 11.74%.
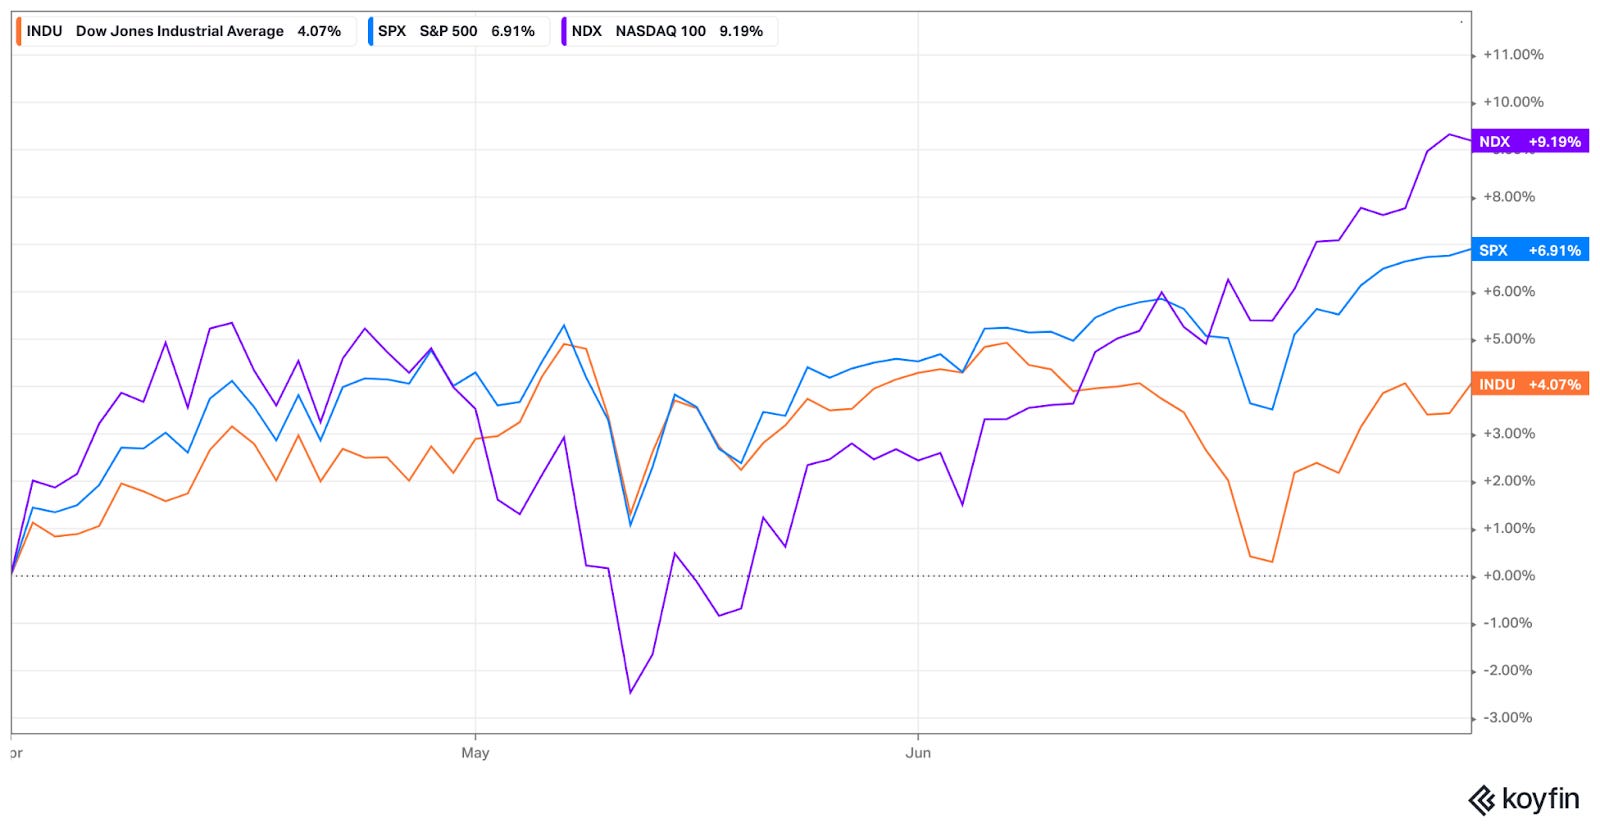
For the same period, the S&P 500 (SPY) returned 8.36%.
The Dow Jones Industrial Average (DIA) returned 4.88%.

Returns for individual accounts may vary as each account is managed separately. While indices serve as a useful benchmark, each portfolio is tailored towards each investor’s unique investment objectives and risk profiles.
Market

The bull market continued throughout the quarter, notching new all time highs with a clear upward trend.
For the beginning of the quarter, the market focused on the increasing interest rates, inflation, and strong reopening momentum. Economically-sensitive areas such as energy, financials, and industrials led the market.
Supply-side shortages led to increasing prices, as production continued to ramp up to demand.
Commodities across the board, including metals, crude, and lumber, shot up in price.
Semiconductor shortages caused a backup for many supply chains; one example being new cars. Nearly-completed cars sat on lots waiting for chips. The price of new cars shot up, putting upward pressure on the used car market.
The housing market has similarly seen upward pressure in pricing, hitting record highs due to high demand, limited inventory, and low interest rates. In certain markets, houses are going for 20-30%+ over asking price. The median sales price of new houses in May 2021 was $374,400, up over 15% from the prior year. The median existing-home price rose to $341,600 in April, up 19% from a year earlier.
From 2001 to 2020, builders added 1.225 million new housing units per year, down from the 1.5 million average from 1968 to 2000. Economists estimate a deficit of between 3.8-5.5 million homes. Even if builders were to significantly increase the rate of new homes, it would take nearly a decade to close the deficit.
In June, the market narrative began to change. Interest rates receded as inflation scares were better understood as transitory, driven largely by supply-side constraints. Economically-sensitive sectors pulled back as technology returned to the forefront. These rotating pullbacks within the market temper the buildup of excess in any one area.
The Federal Reserve remains supportive. Unemployment continues to improve.
All indices closed out the quarter near all time highs.
Portfolio
The following cohorts are bucketed by their contribution to the portfolio. In other words, the ranking considers both the performance of the individual stock and position sizing.
Top performers in Q2
NET. Cloudflare continues to innovate, clearly demonstrating superiority over their competitors. Here’s a comprehensive recap of what Cloudflare has been up to. NET is +45% in the last 3 months and +37% YTD.
CRWD. Crowdstrike acquired Humio as they seek to extend their endpoint detection solution to incorporate more information such as log data. Sentinel One, a notable competitor, went public. While I will be monitoring for any signals, I believe Crowdstrike to be a superior company. CRWD is +34% in the last 3 months and +19% YTD.
FB. Facebook notched a big win in the courts, when a judge ruled in their favor over a large antitrust charge. FB’s market cap crossed the 1 trillion mark, 17 years after inception. FB is +19% in the last 3 months and +30% YTD.
GOOGL. Alphabet continues to benefit from the reopening, as travel sectors turn their advertising back on. Google’s cloud platform continues to excel, growing nearly 50% year over year. GOOGL is +15% in the last 3 months and +40% YTD.
ANET. Arista Networks, whose servers are used to build out data centers, is benefiting from the increasing investment in the cloud. They also continue their expansion into software offerings with the acquisition of Awake, an AI-driven security offering, and other network protection offerings. ANET is +18% in the last 3 months and +25% YTD.
Bottom performers in Q2
WDAY. Workday recently acquired Peakon, an employee success platform. While the market is concerned about a slowdown in growth rates, I view Workday as a long-term play on the rising importance of people within a company. WDAY is -8% in the last 3 months and -2% YTD
PAYC. Similarly to Workday, Paycom’s growth rate has slowed versus historical. As unemployment benefits wane off in the next quarter, I expect to see Paycom’s growth accelerate. Paycom is -0% in the last 3 months and -16% YTD.
CHD. Church and Dwight is a consumer packaged goods company and tends to be less volatile than other companies in the portfolio. If (or when) inflation were to return, they would be able to pass through any inflation-related costs to end users. CHD is -1% in the last 3 months and -2% YTD.
SWKS. Skyworks is a semiconductor company that builds connectivity chips for use in 5G, IoT, etc. Apple accounts for over 55% of Skyworks’ sales. Apple has recently entered competition with Qualcomm. I don’t necessarily see Apple immediately entering Skyworks’ business, since there are a few formidable competitors. While I am bullish on connectivity, Skyworks represented too much risk (commoditization, customer concentration, etc) where I began to doubt their durability. If Skyworks were to have no competitors or a unique competitive advantage, Apple would likely compete directly. If there are clear substitutes from competitors, that can and will deteriorate pricing power over time. I cut SWKS from the portfolio this last quarter. SWKS is up 1% in the last 3 months and +25% YTD.
ABC. AmerisourceBergen acquired the majority of Walgreens' Alliance Healthcare business, which will reinforce and extend their core competency in pharmaceutical distribution. Opioid liabilities and concerns continue to fade. ABC is -1% in the last 3 months and +19% YTD.
Other highlights
UPST. Upstart’s lock up expiration ended in mid-June. Employees now have the ability to trade shares. Leading up to this event, short interest had skyrocketed, a play on share price pressure due to the expected influx of new shares. That speculative behavior resulted in significant volatility. With that behind us, Upstart is looking like it has gained its footing. UPST is -14% in the last 3 months and +204% YTD.
NVR. NVR is a top-notch, well-managed US home builder. As noted previously, there is a secular need for housing. I’ve been adding to positions in NVR. NVR is +4% in the last 3 months and +25% YTD.
Insights
It is important to differentiate volatility from risk. These two concepts can, and often do, mean different things to different investors. Volatility is the movement in share price. It is often used as a proxy for risk. I subscribe to the thinking of risk as the concern of permanent loss of capital.
While market volatility can be hard for some to digest, it can be rewarding in the end. Our technology positions reacted strongly to the increasing interest rates early on in the year, pulling back quite aggressively. Many of those same companies are now rallying and leading the market to new highs.
Relatedly, investing at new market highs can be difficult for many investors. While understandable, it is important to note what a new high means: all investors are holding gains. I expect profit taking to occur and it is likely we’ll see continuing rotation within the market.
However, strength typically begets more strength. Ryan Detrick from LPL Financial points out that when the S&P 500 is above 12.5% for the first half, the median for the rest of the year jumps to 9.7% versus average of 5.0%
--
Federico Torre
Torre Financial
federico@torrefinancial.com
https://torrefinancial.com
https://torrefinancial.substack.com
Disclaimer: This post and the information presented are intended for informational purposes only. The views expressed herein are the author’s alone and do not constitute an offer to sell, or a recommendation to purchase, or a solicitation of an offer to buy, any security, nor a recommendation for any investment product or service. While certain information contained herein has been obtained from sources believed to be reliable, neither the author nor any of his employers or their affiliates have independently verified this information, and its accuracy and completeness cannot be guaranteed. Accordingly, no representation or warranty, express or implied, is made as to, and no reliance should be placed on, the fairness, accuracy, timeliness or completeness of this information. The author and all employers and their affiliated persons assume no liability for this information and no obligation to update the information or analysis contained herein in the future.