


Earnings Review - December 17, 2022
Market commentary, portfolio company earnings results, and a deeper dive into Adobe (ADBE)

Market
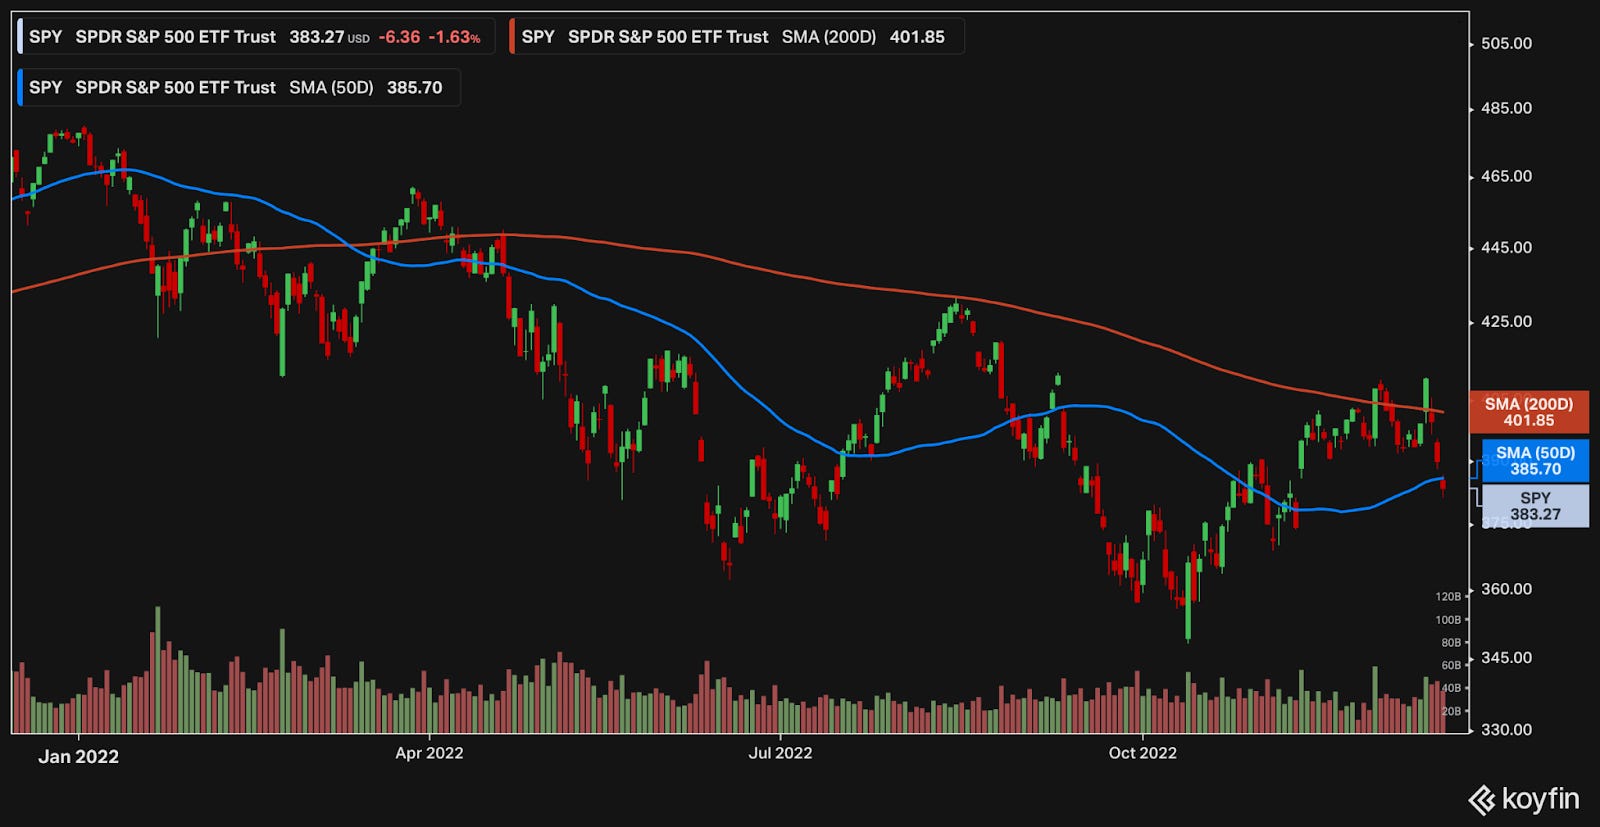
After crossing the 200-day average twice, the S&P 500 has come back to below the 50-day average. Although a pullback is not unexpected, it will be important to find support and form a higher low for the market to continue to climb.
November CPI
The November CPI report was released on December 13th. Inflation came in cooler than expected, at 7.1% vs 7.3% expected.
Markets initially cheered the result. The better-than-expected deceleration helps cement inflation’s downtrend, down from the summer peak of 9%.

Data from FRED St. Louis Fed
Many are quick to point out that 7.1% is still a big number, which is problematic. That being said, the dramatic changes in the economy make this headline number understate the future outlook.
Year-over-year inflation is backwards looking. It compares the consumer price index of November 2022 to November 2021. It helps understand the price changes as they stand now versus a year ago.
Normally, there is continuity in inflation. The moves are not typically very big. The past year is often a good indicator of what is to come.
These last few years have been anything but normal. We’ve gone from an economic shutdown, to very loose policies, to the fastest tightening in decades.
Not dissimilar from a SaaS business, where ARR can be a better gauge of next-twelve-months performance, we can get a better picture of inflation by looking at the more recent numbers.
For November 2022, (seasonally adjusted) inflation increased 0.1% from the prior month. If that were to continue for the next 12 months, that would be an annual rate of 1.21%! Wall Street had been expecting an increase of 0.3%.
Looking at the historical monthly changes, there seems to be a clear step down since June’s 1.3% print.

The monthly changes over the last five months (July-November) have been between 0-0.4%.
By annualizing those monthly numbers, we can extrapolate the forward path.

The year-over-year rates smooth out the ups and downs. Inflection points get averaged into the historical trend. It devalues the most recent data, which is often the most valuable for decisions made today. On the flip side, the annualized forward rates jump around to the drastic, non-linear changes, which can make interpretation difficult. While neither is a prediction of future inflation rates, the annualized monthly rate is more informative of what lies ahead.
Fed update
After four rate hikes of 75 bps, the Fed downshifted to a 50 bps rate hike in December. The fed funds rate is now set to 4.25-4.50%
This had been communicated well in advance and was broadly priced into the market.
Powell, and the Fed, are in a challenging spot. It is critical that they balance their actions and their communications to keep inflation in check. The market is very responsive to the Fed’s actions.
If the Fed is too dovish in their remarks, financial markets will price it in (equities will go up, yields will come down, borrowing is easier, etc). Loosening monetary conditions can potentially re-fuel inflation.
On the other hand, if the Fed is too hawkish, they can drive the economy into a deeper recession than is necessary. This can cost many more jobs and significant pain to American households.
The Fed is driven by their dual-mandate of maximum employment and price stability. They often need to be balanced. Unstable prices (i.e. too high inflation) can be detrimental to the long term growth.
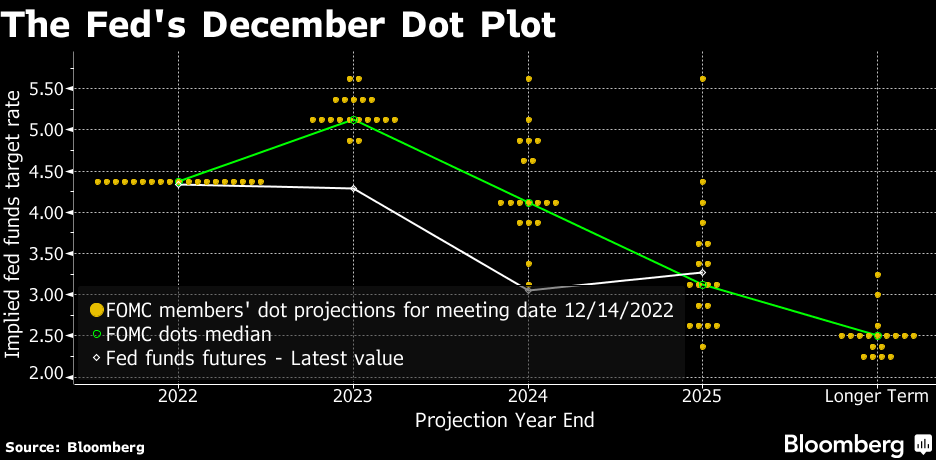
The Fed clearly stated that they are not done with hiking rates and clarified that the speed of hiking rates is no longer the most important factor. “Tighter for longer” was the message.
The dot plot shows they expect to reach 5.00-5.25% in 2023, which implies another 50-75 bps, most likely in 50 bps or 25 bps increments.
The Fed is most worried about the tight labor market and the potential of sticky wage inflation. Inflation-adjusted wages rose by 0.5% in November.
They acknowledge that they can’t predict the future, they don’t know exactly how the economy will digest the existing changes, and that their actions will depend on the data.
Bond market isn’t buying the Fed’s projections
The fed funds rate is the rate at which commercial banks can borrow and lend reserves to each other over night. It is the shortest term – daily. It is now set to 4.25-4.50%
As of December 17, 2022, the 2-year US treasury is trading at 4.18%. If you lock in your money for 2 years, you can get 4.18%.
This is an inverted yield curve – the shorter duration, overnight rate is higher than the 2-year rate. The market is saying that over the next 2 years, you are better off with 4.18% than you would get from the overnight rate (i.e. the overnight rate will come down).

In fact, none of the yields approach the Fed’s 5.00-5.25% over the next 3, 6, or 12 months.
The Fed is in a challenging position, and their primary tools are adjusting the rate and driving the narrative. The bond market seems to be reading past the rhetoric.
Dollar index (DXY)
While we may not be done with rate hikes in the US, there is much more clarity as to the potential outcomes. The Fed is slowing the pace and it seems the ceiling is around 5%.
In the rest of the world, rate hikes are still in full speed. After a 50 bps raise in December, the Eurozone expects significantly more increases. See the difference in progress below.

When the US rates were the first to increase significantly, it brought in investors that wanted a good yield. The result: the dollar strengthened.
As US rates level out, and other rates continue to increase, the US dollar will weaken. This has already begun and is evident in the DXY dollar index (as well as in currency pairs).

On top of rising rates and multiple compression, the strong dollar was a significant headwind for many companies that have international sales.
Marc Benioff, CEO of Salesforce, called it out explicitly in their last earnings call.
“Now for this fiscal year, we're maintaining our revenue guidance of $30.9 billion to $31 billion, up 17% year-over-year or 20% in constant currency.”
“We continue to see the impact of foreign currency fluctuations. And of course, that is our biggest surprise of the year. In the quarter, we saw $300 million year-over-year headwinds to revenue, and we've expected a total of $900 million for the full year. Now that is something we just could not have expected a year ago, and that is when we initiated our revenue guidance. “
As this dollar comes down, this headwind will become a tailwind.
CY Q3 2022 Results
Over the last two weeks, one portfolio company reported earnings: Adobe.

Adobe (ADBE)
From their 10-K:
“Founded in 1982, Adobe is one of the largest and most diversified software companies in the world. We offer a line of products and services used by creative professionals, including photographers, video editors, graphic and experience designers and game developers; communicators, including content creators, students, marketers and knowledge workers; businesses of all sizes; and consumers for creating, managing, delivering, measuring, optimizing, engaging and transacting with compelling content and experiences across personal computers, smartphones, other electronic devices and digital media format.”
Adobe is the parent company behind many well known products including Acrobat, Photoshop, and Illustrator. Over the last decade they have successfully shifted into a subscription business model. Over 93% of their revenue comes from subscriptions.
The business is organized into 3 segments:
digital media which includes creative cloud and document cloud (~73% of revenue)
digital experience which includes data insights, content, commerce, marketing workflows (~25% of revenue)
and publishing and advertising (~2% of revenue)
Similar to Salesforce, Adobe has been acquiring companies and leveraging their ecosystem. The largest acquisitions include Figma ($20 billion, 2022), Marketo ($4.8 billion, 2018), Macromedia ($3.6 billion, 2005), Omniture ($1.8 billion, 2009), Magento ($1.7 billion), Workfront ($1.5 billion, 2020), and Frame.io ($1.3 billion, 2021).
Diving into the financials:

Revenue growth has been consistently double digits, although has been trending downwards recently. After accelerating to y/y rates in 20-25%, they are now looking at 10% and 9% next year.
Gross margin is extraordinarily high at 88%, putting them in the top echelon amongst other SaaS companies. It has increased over time, and has held steady at 88%.
Adjusted EBITDA is similarly very strong, trending higher over time and coming in at just under 50%.
They are highly efficient with their working operating capital. They are effectively getting a free loan of $5.2 billion from their operations, such as by getting paid upfront and/or having favorable terms with their vendors. This has been increasing over time, demonstrating strong pricing power.
FCF margin at 42% is, again, very strong and holding steady.
The share count has been trending lower over time, due to their share buybacks.
Their efficiency metrics are also standout with 45% EBITDA ROC and 38% FCF ROC. Every dollar that has been invested into the company is earning $0.38 per year!
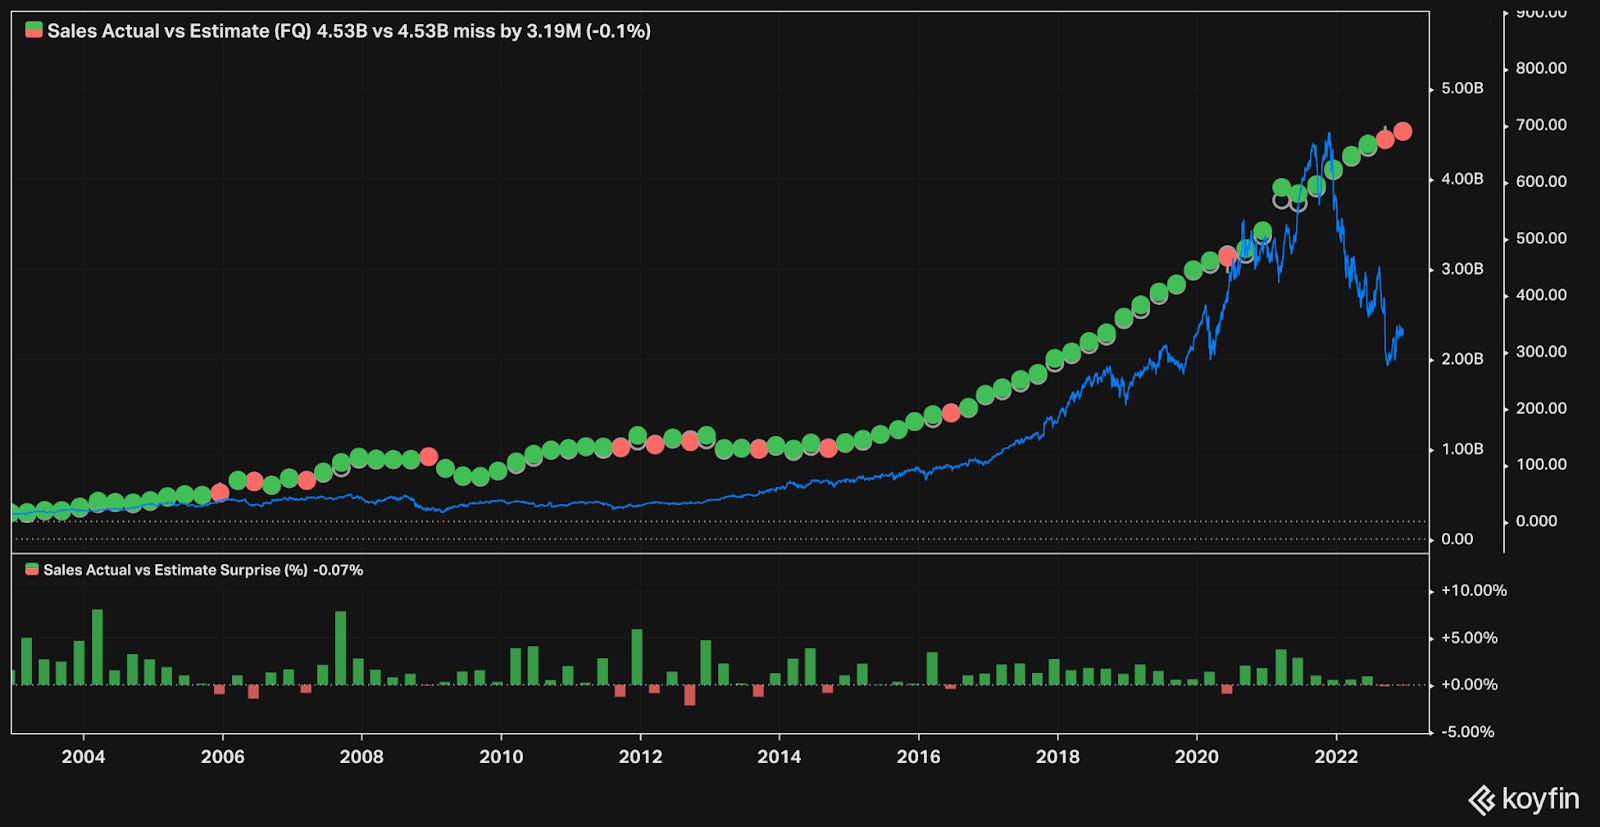
Sales growth has been steady and consistent over time.
Earlier this year, Adobe announced the acquisition of Figma, a fast-growing collaborative design application. It is extremely popular amongst web application development. I use it myself.
It has been highly contentious amongst shareholders due to the high price tag and dilutive effects. Figma has about $400 million in revenue, growing at 100%. Adobe’s purchase price of $20 billion implies a 50x TTM revenue multiple. Perhaps more common in 2021, this is almost unimaginable in the current climate in 2022.
How is it justified? For one, Figma seems to have been on track to become a viable contender against Adobe’s Creative Cloud. Collaboration has been very successful in other productivity apps (i.e. Google Docs). From another angle, Adobe has the distribution channel to quickly scale Figma, as it is a very complementary offering to the other applications they offer their existing customers. Similarly, there will be upsell opportunities to existing Figma customers.
Note that this will alter Adobe’s financial profile. Total capital will effectively double. The share count will expand.
Adobe is paying a premium price. It will take ~2.8 years worth of FCF to pay for Figma. In the first year, it would contribute around 10% of revenue. That being said, this strategic acquisition does seem like it can pay off over time.
Closing
Adobe is a quintessential example of an established compounder. Regardless of changes to the macroeconomy, the combination of consistent growth, high profitability, efficient use of capital, and predictable recurring revenue produces strong results over time.
--

Torre Financial is an independent investment advisory firm focused on emerging and established compounders.
Federico Torre
Torre Financial
federico@torrefinancial.com
https://torrefinancial.com
Disclaimer: This post and the information presented are intended for informational purposes only. The views expressed herein are the author’s alone and do not constitute an offer to sell, or a recommendation to purchase, or a solicitation of an offer to buy, any security, nor a recommendation for any investment product or service. While certain information contained herein has been obtained from sources believed to be reliable, neither the author nor any of his employers or their affiliates have independently verified this information, and its accuracy and completeness cannot be guaranteed. Accordingly, no representation or warranty, express or implied, is made as to, and no reliance should be placed on, the fairness, accuracy, timeliness or completeness of this information. The author and all employers and their affiliated persons assume no liability for this information and no obligation to update the information or analysis contained herein in the future.