


Employment as a Leading Indicator
Employment statistics explained and the correlation to market performance

Valuation metrics get a lot of attention, and rightfully so. Everyone would like to buy low and sell high.
It turns out that common valuation metrics, such as the price-to-earnings ratio, do not have a very strong correlation to market returns for any given year. The scatterplot below, showing trailing P/E and annual returns, offers no decipherable pattern.

Employment, on the other hand, is a direct indicator of the capacity of total output and turns out to be a much more interesting metric to consider as a leading indicator. Before diving in to any analysis, it is important to first understand where employment data comes from.
Employment Statistics
The U.S. Bureau of Labor Statistics, an agency of the U.S. Department of Labor, “measures labor market activity, working conditions, price changes, and productivity in the U.S. economy to support public and private decision making.”

One of the most important activities of the Bureau of Labor Statistics, or BLS, is measuring employment and unemployment. Other notable measurements include consumer price index (CPI), hourly earnings, imports and exports, amongst others.
The basic concepts involved in identifying the employed and unemployed are quite simple:
People with jobs are employed.
People who are jobless, looking for a job, and available for work are unemployed.
The labor force is made up of the employed and the unemployed.
People who are neither employed nor unemployed are not in the labor force
Measuring this, however, can be difficult. Counting every person each month is impractical. Proxies, such as unemployment insurance records, exclude many people (namely, the ones that didn’t apply for unemployment insurance). To determine these statistics, the government conducts a monthly survey called the Current Population Survey (CPS).
For more on the methodology, see How the Government Measures Unemployment.
Monthly Employment Reports
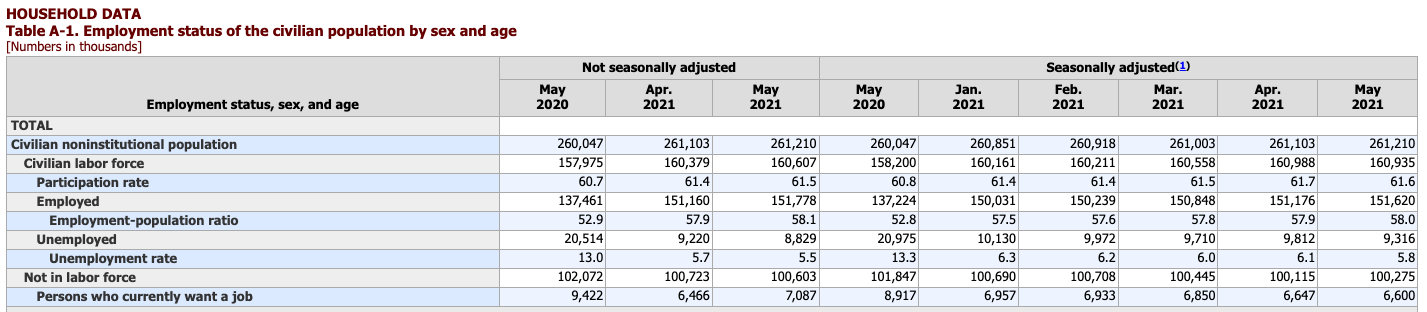
The BLS publishes the employment statistics in a monthly release called the Employment Situation. Key statistics include:
The number of people in the labor force. This measure is the sum of the employed and the unemployed. In other words, the labor force level is the number of people who are either working or actively seeking work.
The national unemployment rate. Perhaps the most widely known labor market indicator, this statistic reflects the number of unemployed people as a percentage of the labor force.
The labor force participation rate. This measure is the number of people in the labor force as a percentage of the civilian noninstitutional population 16 years old and over. In other words, it is the percentage of the population that is either working or actively seeking work.
The employment-population ratio. This measure is the number of employed as a percentage of the civilian noninstitutional population 16 years old and over. In other words, it is the percentage of the population that is currently working.
To access reports from the BLS, see Economic News Releases.
Excerpts from the BLS on relevant categories are provided below. Detailed descriptions are helpful to understand the nuances between employment, unemployment, and those that are not in the labor force.
Employed
People are considered employed if they did any work at all for pay or profit during the survey reference week. This includes all part-time and temporary work, as well as regular full-time, year-round employment. Individuals also are counted as employed if they have a job at which they did not work during the survey week, whether they were paid or not, because they were:
On vacation
Ill
Experiencing child care problems
On maternity or paternity leave
Taking care of some other family or personal obligation
Involved in a labor dispute
Prevented from working by bad weather
Unemployed
People are classified as unemployed if they do not have a job, have actively looked for work in the prior 4 weeks, and are currently available for work. Actively looking for work may consist of any of the following activities:
Contacting:
An employer directly or having a job interview
A public or private employment agency
Friends or relatives
A school or university employment center
Submitting resumes or filling out applications
Placing or answering job advertisements
Checking union or professional registers
Some other means of active job search
Not in the labor force
The remainder—those who have no job and are not looking for one—are counted as not in the labor force. Many who are not in the labor force are going to school or are retired. Family responsibilities keep others out of the labor force. Since the mid-1990s, typically fewer than 1 in 10 people not in the labor force reported that they want a job.
A series of questions is asked each month of persons not in the labor force to obtain information about their desire for work, the reasons why they had not looked for work in the last 4 weeks, their prior job search, and their availability for work. These questions include the following (the bolded words are emphasized when read by the interviewers).
Do you currently want a job, either full or part time?
What is the main reason you were not looking for work during the last 4 weeks?
Did you look for work at any time during the last 12 months?
Last week, could you have started a job if one had been offered?
Excerpts from the BLS’s website: How the Government Measures Unemployment.
Unemployment and the Market
When we look at unemployment versus the market, there seems to be a well-defined inverse correlation.

Crunching the numbers highlights the correlation.
When the unemployment rate has been ...
4.65% or less, stocks have averaged a 4.82% annualized return.
between 4.65% and 5.69%, stocks have averaged a 4.81% annualized return.
between 5.69% and 7.28%, stocks have averaged an 8.42% annualized return.
greater than 7.28%, stocks have averaged a 14.87% annualized return.
The higher the unemployment rate, the higher the return on stocks. While this may seem contradictory at first glance, it makes sense.
From the chart above, stocks appear to sell off shortly after the unemployment rate begins to tick up.
At the low point of the economy, stocks are cheap and unemployment is high.
The potential future return on stocks is high.
As the economy rebuilds, unemployment decreases and more people start working, earning, and consuming.
Employment and the Market
Providing another angle of the same idea, the chart below shows employment as a percentage of the population alongside the log of the S&P 500 since the 1940s.

When the employment ratio tops out and turns south, the market has typically experienced a retraction.
Conversely, when the employment ratio bottoms out and begins turning upwards, the market has generally experienced an upward trend.
The employment ratio has been consistently above the current level of 58% since 1977, with the exception of a brief dip in 1982-1983.
Recent peaks in the employment ratio have been around 61%-65%, indicating plenty of upside from the current 58%.
Closing
Employment numbers appear to have a meaningful correlation to stock market returns and be a useful leading indicator.
While necessary in 2020, the continued stimulus and fiscal spending has likely dampened a quicker recovery in the employment rate in 2021. As the overly generous unemployment benefits end in September and fears regarding COVID continue to recede, employment should continue to move steadily higher.
Today there are roughly 10,000,000 people looking for a job in the United States.
If employment provides any meaningful indication, it could signal a higher stock market in the years to come.