


Market & Earnings Review - February 4, 2023
Market commentary, portfolio company earnings results, and closer look into META

Market

Markets are off to a strong start in 2023. The market was able to bounce off the December lows, forming a higher low and building momentum for the move higher.
The S&P 500 index currently sits firmly above both its 50-day and 200-day moving averages. The 50-day moving average crossed above the 200-day moving average, a bullish indicator known as the Golden Cross. for the first time since March 2022.
The current move has taken place very quickly. In just over a month, the S&P 500 is up nearly 8% and the Nasdaq is up 15%. Traders may have been caught off guard. The patient investors, investing in companies for the long term, shouldn’t have had an issue.
Growth-focused and/or speculative companies, many of which sold off significantly in 2022, have seen particularly strong momentum. In addition to the risk on appetite, short sellers seem to be covering their positions.

Notwithstanding their staggering performance, many of these companies have plenty of ground yet to cover.
As the path of inflation and rate hikes became more clear, the market’s attention focused on earnings. Evidence of a soft landing for the economy, coupled with a less hawkish tone from the Fed, has encouraged the risk on sentiment. Dips are being bought. It seems no one wants to get left behind.
With rates coming down and the market pushing higher, it is reasonable to ask whether the market has gone too far.
US 2 year treasuries are currently yielding ~4.2%. The last time rates were at a comparable level was roughly 2005-2007.

As of February 2023, the S&P 500 has a P/E multiple of roughly 19x.
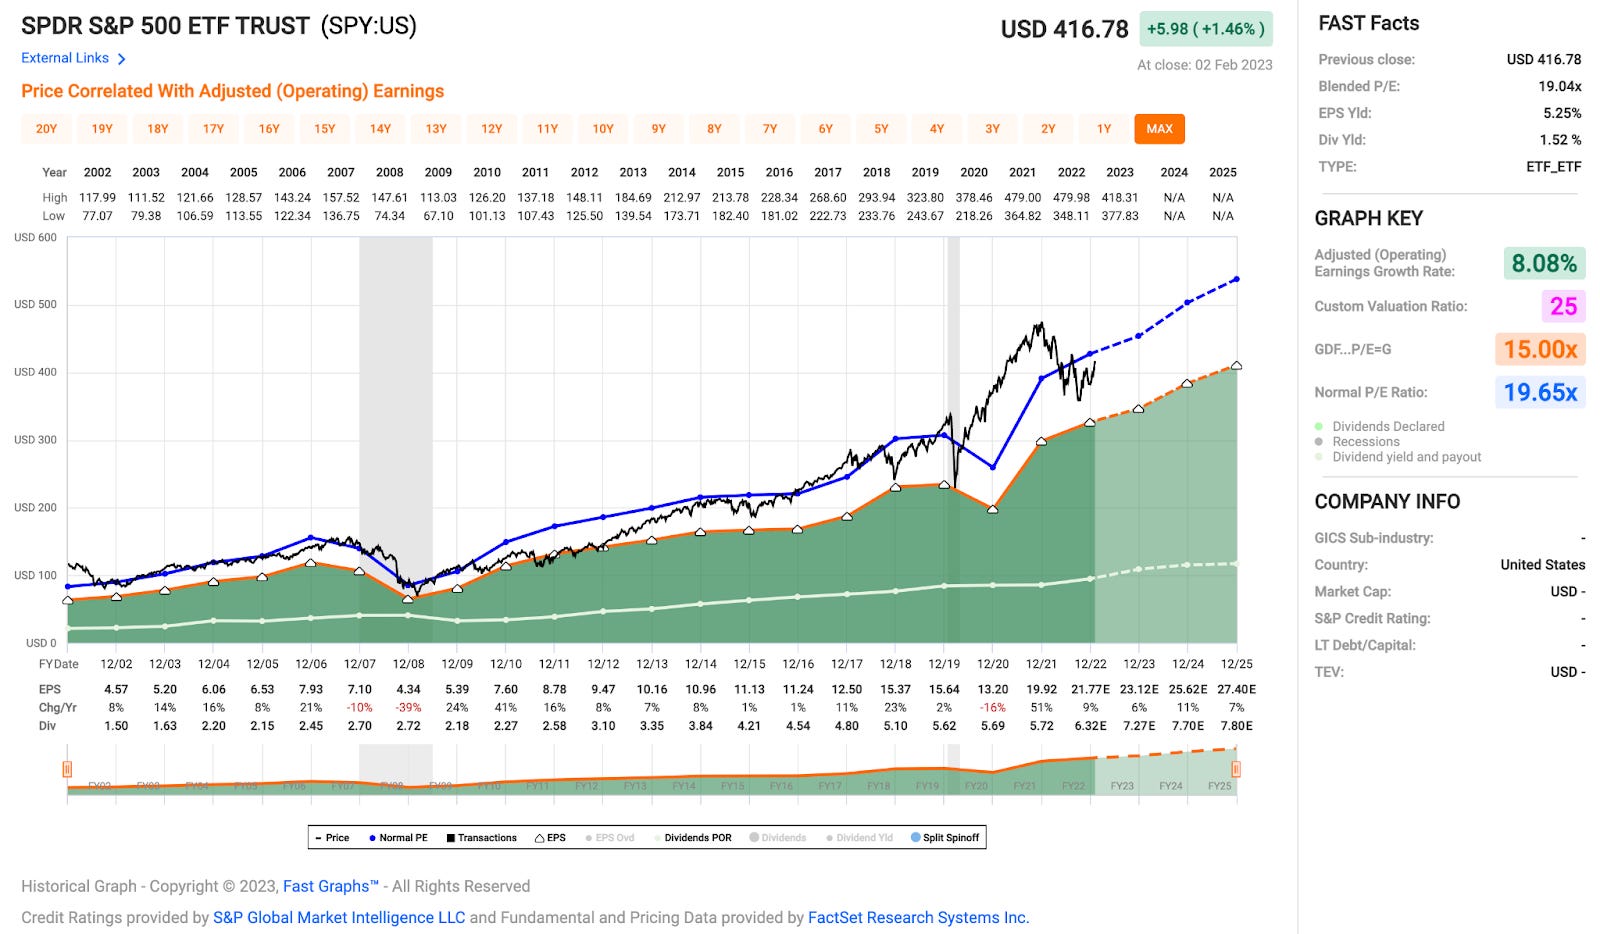
During 2005-2007, the P/E multiple ranged between 16.9-21.5x, the average of which is 19.2x.
With rates on the decline and the economy seemingly holding up, the market does not necessarily seem overvalued. That being said, it would be reasonable to expect a pullback after such a quick ascent.
Q4 2022 Earnings
Over the last two weeks, 10 portfolio companies reported earnings: Microsoft, Intuitive Surgical, Service Now, Mastercard, Visa, Moody’s, MSCI, Meta, Alphabet, and Amazon.

Results have been generally positive, against a gloomy backdrop. Companies have generally been providing a better outlook for 2023 than feared. Some analysts were expecting guidance for the year to crater, dropping as much as 20-30%. The fact that that has not come to pass has been met with enthusiasm.
Some observations:
Cloud titans (MSFT, GOOGL, AMZN) are seeing a slow down in cloud spend, particularly due to companies looking to optimize spending.
ServiceNow (NOW) gave a positive outlook for the year, helping boost sentiment around broader SaaS companies.
Mastercard (MA) and Visa (V) continue to perform. Because their business models are a commission on each transaction, they have been able to benefit from inflation. They also benefit from increasing travel, as cross-border transactions are an important contribution.
Moody’s (MCO), which benefits from issuance of debt, faces difficult comps. The low rates of prior years boosted debt issuance, which with higher rates is now less appealing. They increased their share buyback plan by $250M.
Meta had a turnaround quarter, which was well received by the market. More details below.
Meta (META)
The parent company behind Facebook, Instagram, Whatsapp, has had a difficult few years.
In 2021, Apple released a feature called App Tracking Transparency which limited the ability for companies to track user behavior across applications. This change complicated ad targeting and conversion attribution for app-based advertisers.
The rise of competitors including TikTok and YouTube Shorts has threatened its core business.
Facebook had been under significant scrutiny from regulators, damaging their brand reputation
Last year, the company rebranded from Facebook to Meta, underscoring its commitment to virtual reality as the next platform for interaction. This commitment was backed by $10’s of billions of dollars of spending on the new platform.
Investors were worried about the changing landscape, and the stock price took a significant hit, down from a peak of $380 in September 2021 to a low of $88 in November 2022.
At that price, the company, insofar as operations would continue, was quite attractively valued.
Q4 seems to have been a turning point for the company. The company reported increased engagement across all of their apps, hitting a new high of 2.96 billion daily active people, up nearly 5% y/y. Monthly active people similarly reached a new high of 3.74 billion, up over 4% y/y. Facebook hit a new high of 2 billion daily active users, up 3.6% y/y.
Below is a summary of the financials:

Revenue came in at $32.2 billion, towards the high end of their guidance of $30-32.5 billion.
Although y/y revenue growth was -4%, it appears to be stabilizing. On a constant currency basis, revenue was actually up 2% y/y. Q/q revenue growth was strong at +16%.
Margins have been under pressure, principally from restructuring costs, possibly due to weaker pricing from the current macro environment, and forex headwinds.
Spending looks to be at an inflection point. They seem to be getting control. After climbing from 19% up to 32% of revenue, R&D has now turned around to 30%. SG&A has similarly turned down to 24% from 25%.
FCF margins are under pressure. Q3 was an outlier, dampening TTM FCF. Notwithstanding, capex came in high again this quarter. Prior to 2022, capex was consistently in the 4.5 billion range. Since then, it essentially doubled to the 9 billion range. Guidance and commentary, however, was more bullish.
Other updates from the quarter:
“Our management theme for 2023 is the 'Year of Efficiency' and we're focused on becoming a stronger and more nimble organization." - Zuckerberg
Meta announced a $40 billion increase to share repurchase program, adding to the $10.87 billion available. This program represents over 10% of their current market cap.
Advertising represents 98% of revenue. Reality Labs represents 2%.
Regarding their outlook for the year:
Q1 revenue guidance came in at $26-$28.5 billion (mid point $27.25) vs consensus of $27 billion. Although representing a -2% y/y decline, it is an improvement vs. the current and prior -4% declines.
Guidance for full year expenses was reduced from $97 billion to $92 billion.
Guidance for full year capex was reduced from $35.5 billion to $31.5 billion, or $7.875 per quarter.
Investors have cheered the newfound focus on core products and efficiency. The stock price has more than doubled from the low of $88 to $188 in just a few months.

After such a dramatic move up, it begs the question around valuation.

Revenue, EBITDA, and FCF multiples are not unreasonable. Even with the suppressed TTM FCF, the current valuation supports a 4.1% trailing yield. Extrapolating the current quarter’s FCF out to the next 4 quarters would yield closer to 4.7% – surpassing short term yields, and with opportunity for continued growth.
Closing
The performance from this first month of the year is unlikely to continue throughout the year. After such a strong move up, a pullback is to be expected. That being said, the tide does seem to be turning with less uncertainty around rates, inflation, and earnings.
As for Meta, they seem to have heard their investors. In a significant change of posture, Meta tempered their ambitions for the metaverse and renewed their focus on their existing business. Meta’s moat continues to deepen with their investments in AI for both engagement and conversion tracking and large and growing user base. Investors have cheered their recent moves. Even after the recent move up, any future value from their metaverse ambitions doesn’t seem to be priced in.
--

Torre Financial is an independent investment advisory firm focused on emerging and established compounders.
Federico Torre
Torre Financial
federico@torrefinancial.com
https://torrefinancial.com
Disclaimer: This post and the information presented are intended for informational purposes only. The views expressed herein are the author’s alone and do not constitute an offer to sell, or a recommendation to purchase, or a solicitation of an offer to buy, any security, nor a recommendation for any investment product or service. While certain information contained herein has been obtained from sources believed to be reliable, neither the author nor any of his employers or their affiliates have independently verified this information, and its accuracy and completeness cannot be guaranteed. Accordingly, no representation or warranty, express or implied, is made as to, and no reliance should be placed on, the fairness, accuracy, timeliness or completeness of this information. The author and all employers and their affiliated persons assume no liability for this information and no obligation to update the information or analysis contained herein in the future.