


Market & Earnings Review - June 24, 2023
Market commentary, portfolio company earnings results, and closer look into Adobe (ADBE)

Market
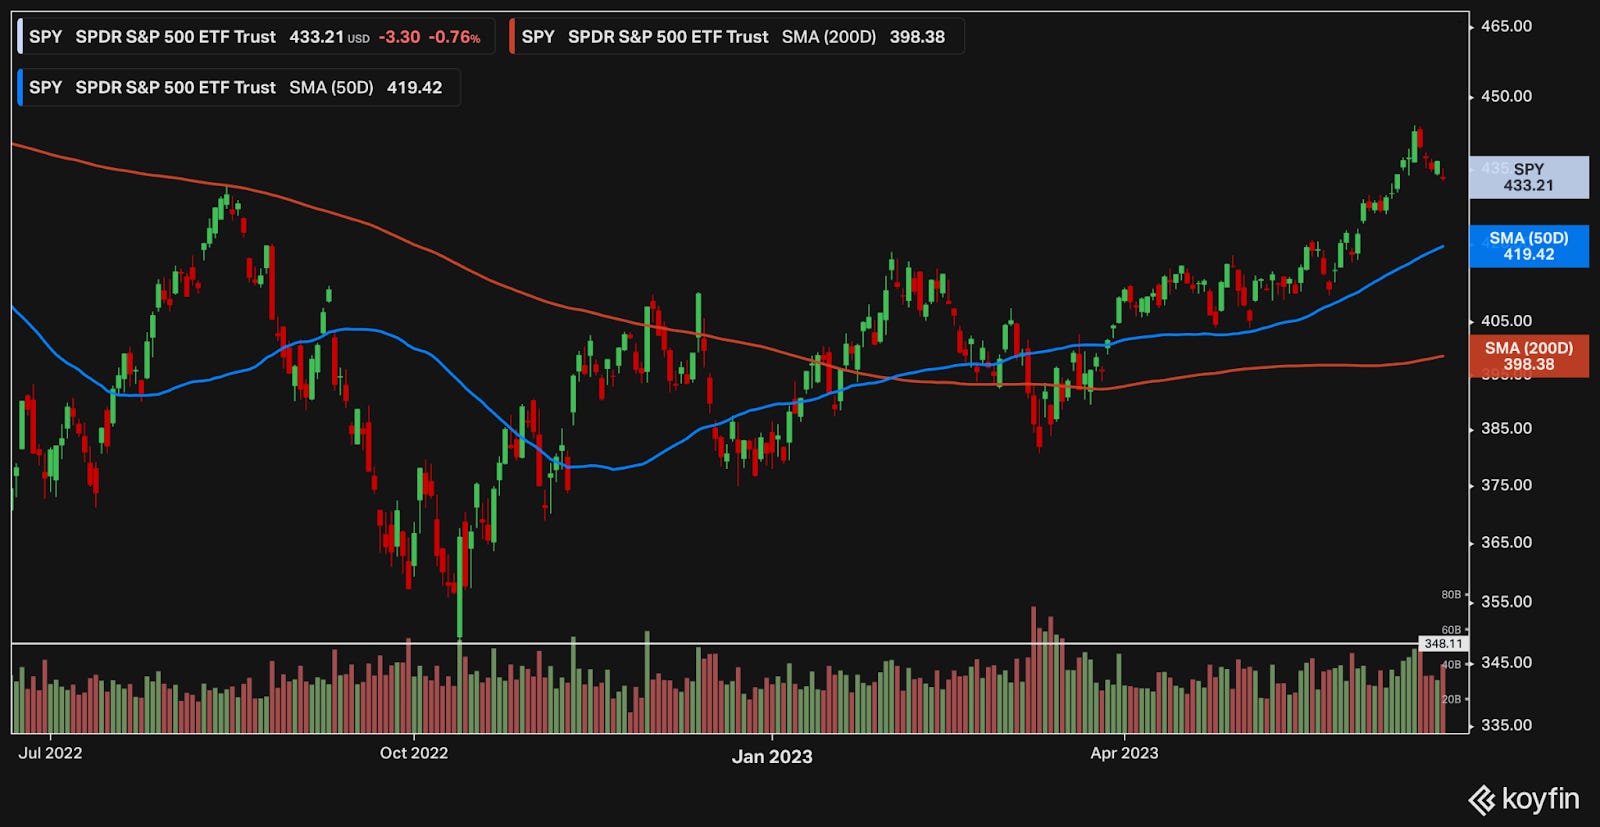
The market has been building momentum with the recent buying relentlessly pushing prices higher. The index easily blew past the August 2022 high of 435.
Resistance at the 445 level brought a 5-week winning streak to an end. The S&P closed this week with a loss of 1.5%. Given the gap recent gap up, it wouldn’t be surprising to see this pull back retreat further and test the 420 level. If that level holds and 420 becomes a level of support, the market may be well positioned to continue higher.
Sector rotation
Given the popularity of artificial intelligence this year, it is no surprise that technology has been leading the way. The Technology sector is up nearly 38% year to date, followed closely by Communications (34%) and Consumer Discretionary (30%).
Year to date (YTD)

Technology’s leadership, however, looks to be facing some resistance. During the month of June, performance has fallen into the middle of the pack. Industrials and Material look to have gained some strength. This type of market rotation is typical, as investors sell shares that appear over extended to buy more reasonably-valued companies.
Month to date (MTD)

Zooming in closer to the last 5 days shows some relative strength for Healthcare.
Last 5 days

Other takeaways:
Consumer Discretionary seems to be holding up well across all periods.
Financials, Real Estate, and Energy seem to be squarely out of favor.
Recent relative strength indicates a shift towards more defensive posturing. This is not uncommon after such a strong run up. It is possible that this rotation continues.
Bond market
The bond market similarly calls for caution. The 10-2 yield curve, which inverted in July 2022, has yet to show signs of reverting. In fact, the spread has significantly widened in June 2023. The yield curve is said to be inverted when shorter duration bonds (i.e 2 year) pay more than higher duration bonds (i.e. 10 year).

The financial system relies heavily on duration mismatch for lending, benefitting from the normal spread. When the spread is inverted, lending is no longer attractive. Financial companies stop lending, leading to a reduction in economic activity.
While momentum can be a powerful multiplier and the market can surely continue running higher, prudence would warrant a more cautious approach at this time.
Q1 2023 Earnings
Over the last two weeks, 1 portfolio company reported earnings.

Adobe (ADBE)
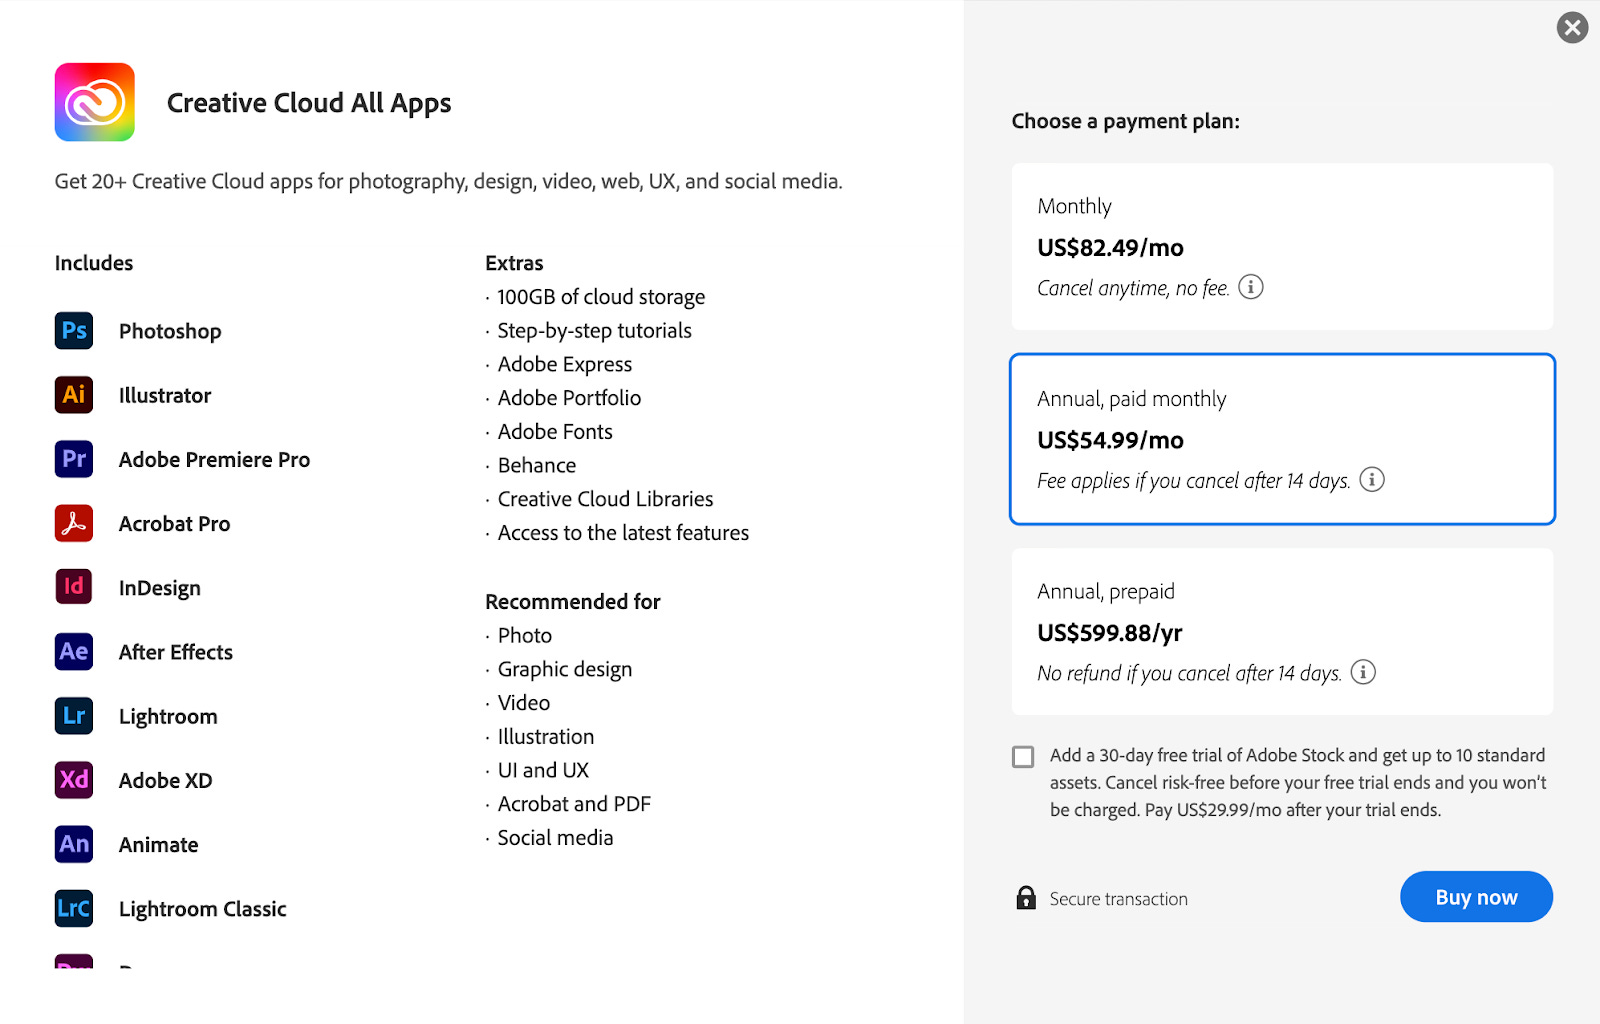
Adobe is the parent company behind many well-known products including Acrobat, Photoshop, and Illustrator. Over the last decade they have successfully shifted into a subscription business model. Over 93% of their revenue comes from subscriptions.
Their Creative Cloud offerings, alongside PDF and e-signature offerings, contribute nearly 75% of Adobe’s revenue.
The remaining 25% of revenue comes from digital experiences including analytics, marketing, insights, as well as publishing and advertising.
Adobe has been well positioned for the rise of AI and has been quick to solidify their market leadership. While a lot of generative AI hype has been focused on text, images are another powerful category.
Adobe Firefly, a suite of generative AI tools, was released in March. Different from open-source solutions, Firefly is purpose built for the enterprise. It takes into account copyright concerns, allowing companies more control over the source content for generation. Directly integrated into Adobe workflows, users of all experience levels are able to do much more with Adobe products.
This video helps demonstrate the full power – Adobe Firefly: Future Explorations.

These are difficult tools to get right. Adobe’s size, distribution, and the power of these tools is very compelling. These last few months have helped dispel concerns about Adobe having a narrow moat under siege from startups.
Turning to the financials:
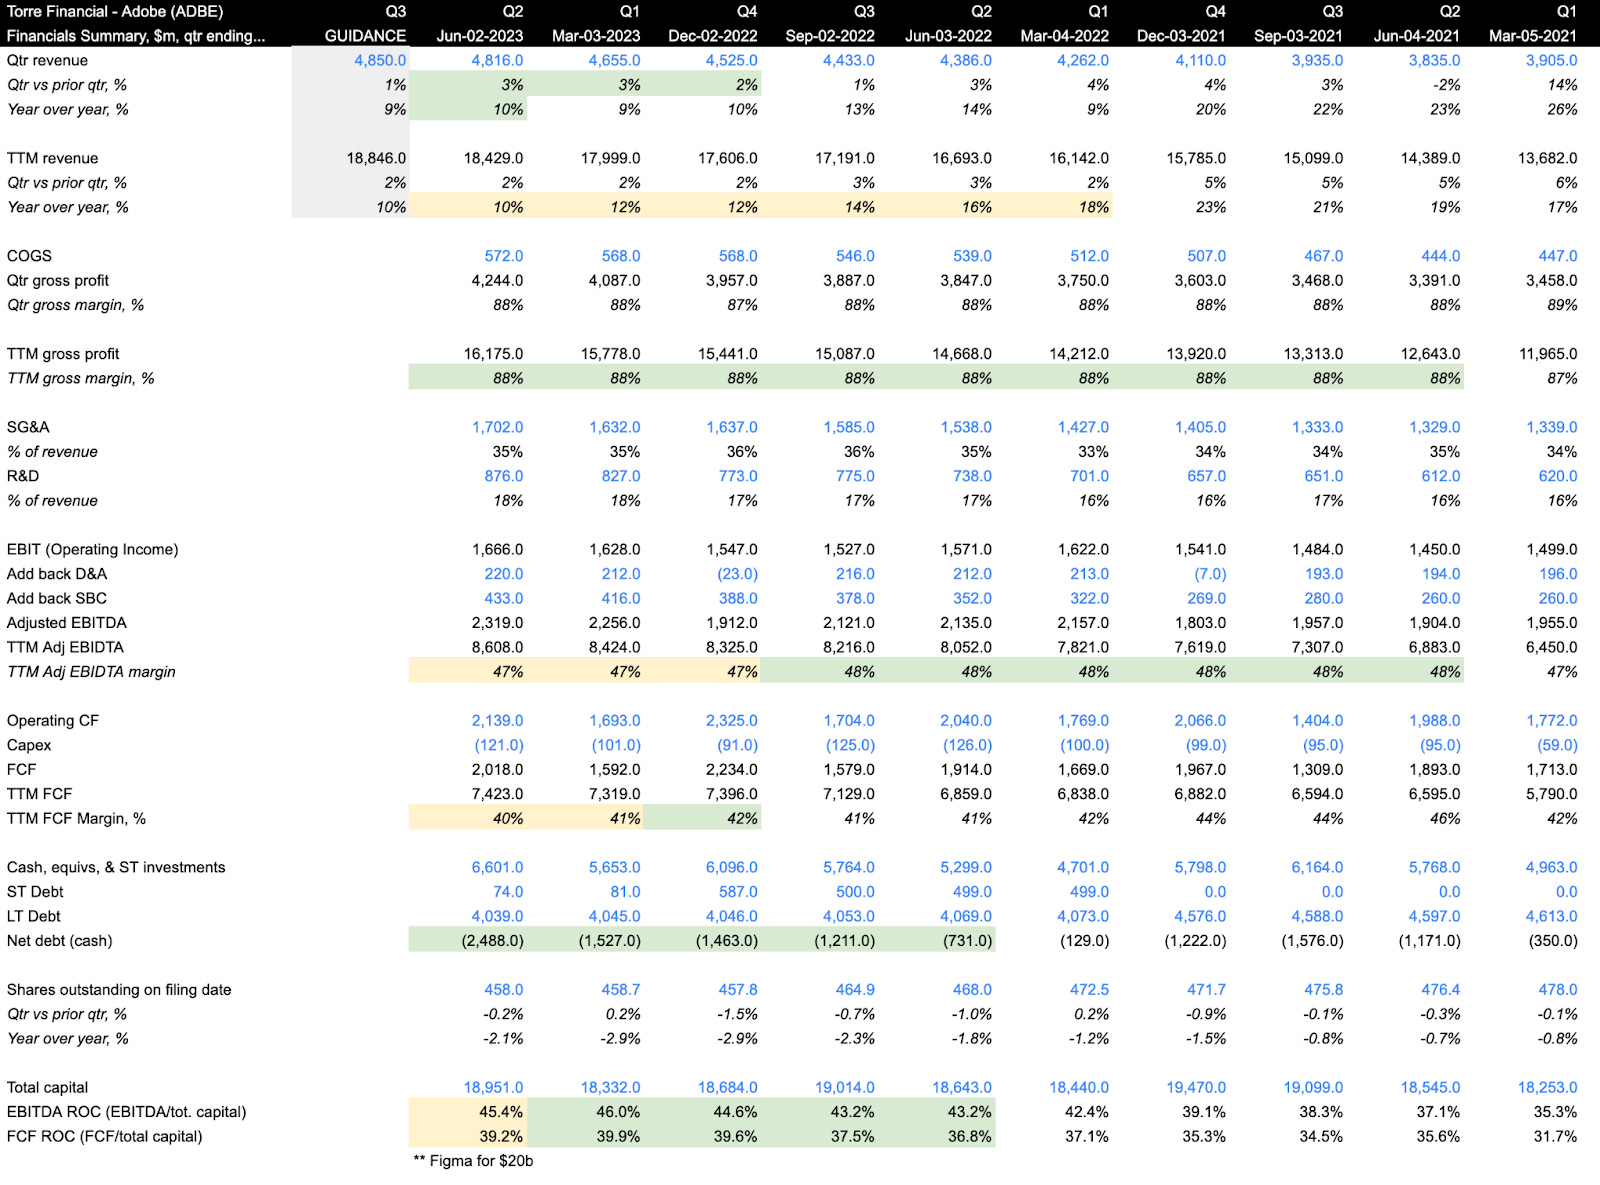
Revenue growth seems to be stabilizing at 10%. Growth accelerated in Q2 vs. Q1, indicating a potential bottom.
Gross margins have been steady at 88% over the last two years, reinforcing Adobe’s strong positioning in the market, efficiency in delivery, and their pricing power.
EBITDA margins have been steady in the tight range of 47-48%
FCF margins north of 40% are similarly impressive. For every $100 in revenue, Adobe has $40 in free cash flow to spend as they like.
Cash has been accumulating on the balance sheet. Net cash has grown to $2.5 billion from $731 million a year ago.
Shares outstanding continue to decline due to Adobe’s share repurchase program. Annual share decline of 2% to 3% is a very powerful multiplier, especially when coupled with growth and efficiency.
Capital efficiency is impressive at 40-45% across EBITDA ROC and FCF ROC. For every $100 invested in the company, Adobe is able to generate $40/yr! Note that the total capital is expected to more than double after the close of the Figma acquisition.
Inline with other technology companies, Adobe’s share price has experienced heightened volatility. Shares dropped in 2022 down to $275, from a peak of around $680. The combination of rate hikes, pressure on technology companies, and the acquisition of Figma are likely drivers of the sell off. The story changed in 2023. Investors digested the acquisition, rate hikes look to be tapering down, and Adobe has driven investor confidence with their push into AI. Shares were up over 88% from the low. While technical indicators show momentum, the ascent has been quick. A short-term pull back would not be unexpected.

As for the valuation:

Even with the recent climb, Adobe appears reasonably valued. The revenue multiple looks to be towards the higher end, but given their strong profitability, the EBITDA multiple of 21.5x is very reasonable for a company of this quality.
Adobe is yielding FCF of 3.4% combined with 10% growth. An alternative, risk-free option would be the 10 year treasury yielding nearly 3.7%. Treasury yields are expected to decline over time, while Adobe’s growth can be expected to continue.
The following table shows potential annualized returns over the next 5 years given a spectrum of EBITDA multiples and EBITDA growth rates. This model excludes the Figma acquisition and incorporates a 2% annual share count reduction.

Assuming slight multiple compression and achievable growth, investors could reasonably expect annualized returns in the range of 8-15% over the next five years.
Closing thoughts
The laggards of 2022 – technology – have brought new life to the markets in 2023. This is just another example of the ever-rotating nature of the market. The difficulty is knowing the duration of these trends – how long and how high will the AI hype go?
Investors are best served by staying attentive to a broad array of data and continually reassessing the odds. Similarly to how rates are now closer to the peak than not, equity markets seem to be more optimistic than not.
While some companies have extended valuations, there continue to be attractive opportunities for investment – quality companies with an solid outlook trading at a reasonable valuation.
Microsoft, with an overly positive outlook, seems to be quite expensive — I’m trimming. Adobe, notwithstanding the rapid ascent, still appears to be reasonably priced — I’m holding. Some companies such as PayPal, ADP, and Booking appear to be good candidates for accumulation. As always, investors should their due diligence and make their own decisions.
Torre Financial is an independent investment advisory firm focused on emerging and established compounders.
Federico Torre
Torre Financial
federico@torrefinancial.com
https://torrefinancial.com
Disclaimer: This post and the information presented are intended for informational purposes only. The views expressed herein are the author’s alone and do not constitute an offer to sell, or a recommendation to purchase, or a solicitation of an offer to buy, any security, nor a recommendation for any investment product or service. While certain information contained herein has been obtained from sources believed to be reliable, neither the author nor any of his employers or their affiliates have independently verified this information, and its accuracy and completeness cannot be guaranteed. Accordingly, no representation or warranty, express or implied, is made as to, and no reliance should be placed on, the fairness, accuracy, timeliness or completeness of this information. The author and all employers and their affiliated persons assume no liability for this information and no obligation to update the information or analysis contained herein in the future.