Distribution of Returns in the Market
Insights from a comprehensive study on over 8,000 stocks across a 23 year period.
All returns are not created equally. In fact, there is a significant imbalance in the distribution of returns across market participants.
Eric Crittenden and Cole Wilcox conducted a study in 2008 to investigate what returns look like underneath the surface. Analyzing the performance of over 8,000 individual stocks from 1983 to 2006, their research provides interesting insights as to the distribution of returns.
The full study is available at The Capitalism Distribution: Fat Tails in Action.
Lifetime Returns
Assessing the total lifetime returns of the 8,000 stocks, Crittenden and Wilcox found that:
Roughly 3 out of every 5 stocks made money over time (conversely, roughly 2 out of 5 stocks lost money over time)
Roughly 1 out of every 5 stocks lost 75% or more of their value over time.
Roughly 1 out of every 5 stocks was a big winner, notching gains of over 300%.
Mean and Median
The mean, or average, annualized return across the cohort was negative. Hence, having invested equally across all stocks would have resulted in losing money.
The median annualized return, however, was a positive 5.1%. Half of the stocks performed better than 5.1% and half performed worse than 5.1%.
The mean being less than the median indicates data set is skewed left. The combination of quantity and magnitude of underperforming stocks drags the average down.
This may provide insight as to why many indices, including the Russell 3000, are market-capitalization-weighted as opposed to equal-weighted.
Collective Return
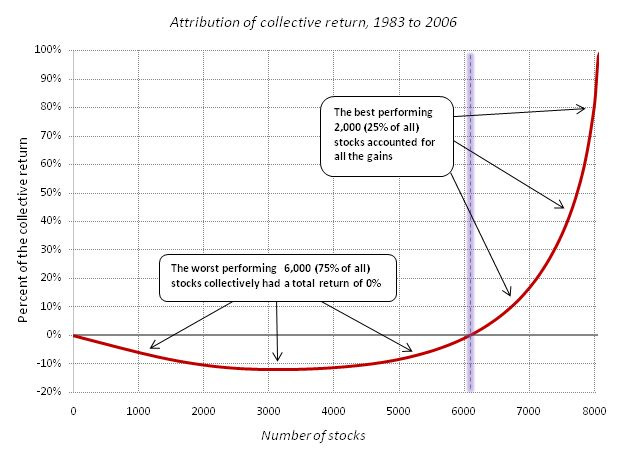
Considering each individual stock’s contribution to the cohort’s collective return, the study found that 25% of stocks account for the entirety of the gain.
Against the Benchmark
When compared to their respective benchmark, the Russell 3000:
About 1/3 of companies outperformed on an annualized return basis (conversely, nearly 2/3 underperform the market)
A small fraction, roughly 4%, significantly outperformed the index with annualized returns more than 30% greater than the index
A much greater proportion, roughly 18%, significantly underperformed the market, with returns of more than 30% worse than the market
Closing
Understanding the dynamics of the market helps investors better understand their own risk and reward trade offs.
There is plenty to digest from the above study. Each investor is likely to come up with their own takeaways, perhaps influenced by their own experiences or preferences.
One investor may see these stats as a vote in favor of passive index investing. Another, may see an investment strategy centered around not losing, or perhaps even seek to profit from losers. Yet another investor may see opportunity in pursuit of the small group of winners.
To be a successful investor is much more than analyzing the numbers. Investing is subjective. It depends on personal objectives, situations, behaviors, and much more. Investors need to seek to understand first and come to their own conclusions, ones wherein they can hopefully find true conviction.


