


Macro Review - March 2022
Review of the markets (indices, sectors, countries, crypto, and commodities) and economy (employment, wages, housing, inflation, interest rates, sentiment)

Information provides a critical edge to investors. Taking a step back to review high-level indicators can be a helpful practice, providing investors with a different perspective.
Reviewing key macroeconomic indicators on a regular cadence can help investors better understand the broader picture and any implications it may have on their portfolio.
Markets
Indices

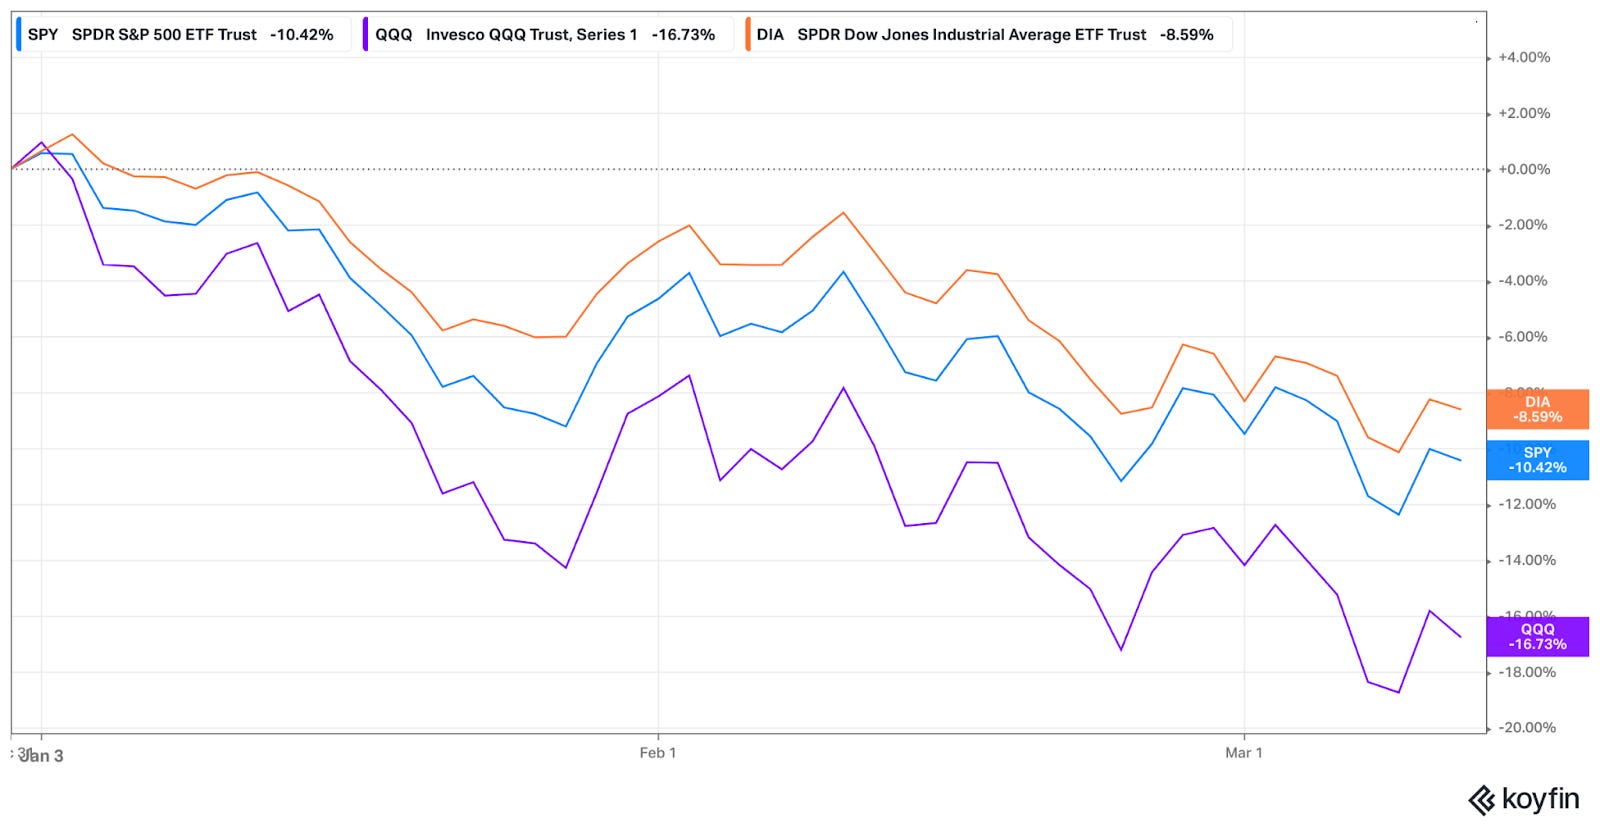
Year-to-date, the Nasdaq (QQQ), S&P 500 (SPY), and Dow Jones (DIA) indices are down -16.7%, -10.4% and -8.6%, respectively.
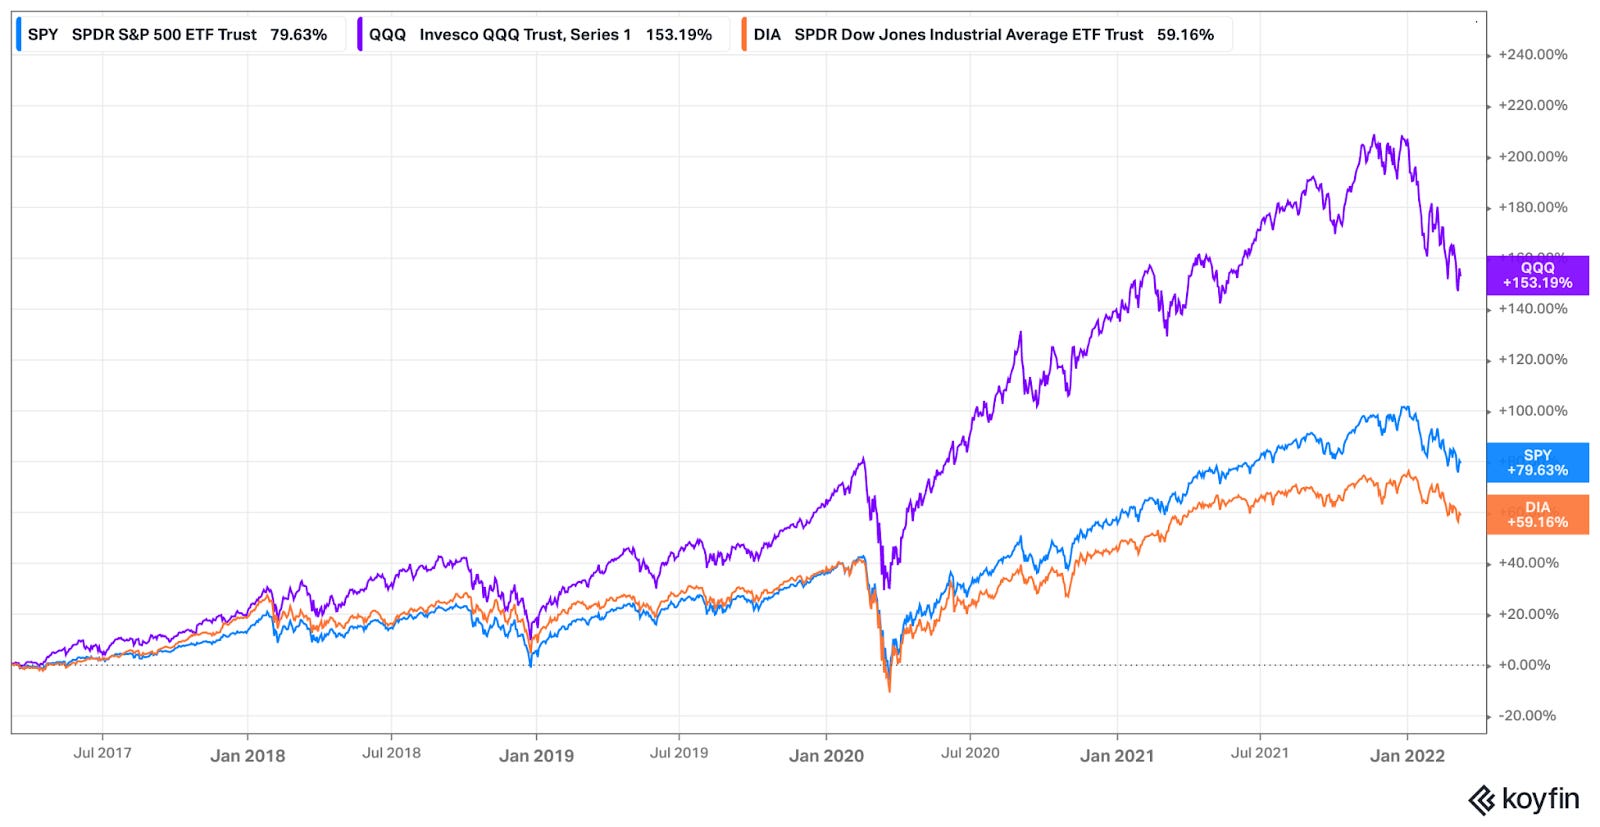
Over a five-year period, the Nasdaq, S&P 500, and Dow Jones indices are up 153%, 80%, and 59%, respectively.
The Nasdaq’s 50-day moving average has crossed below its 200-day moving average, a bearish indicator.

The S&P 500’s 50-day moving average is about to intersect with its 200-day moving average.
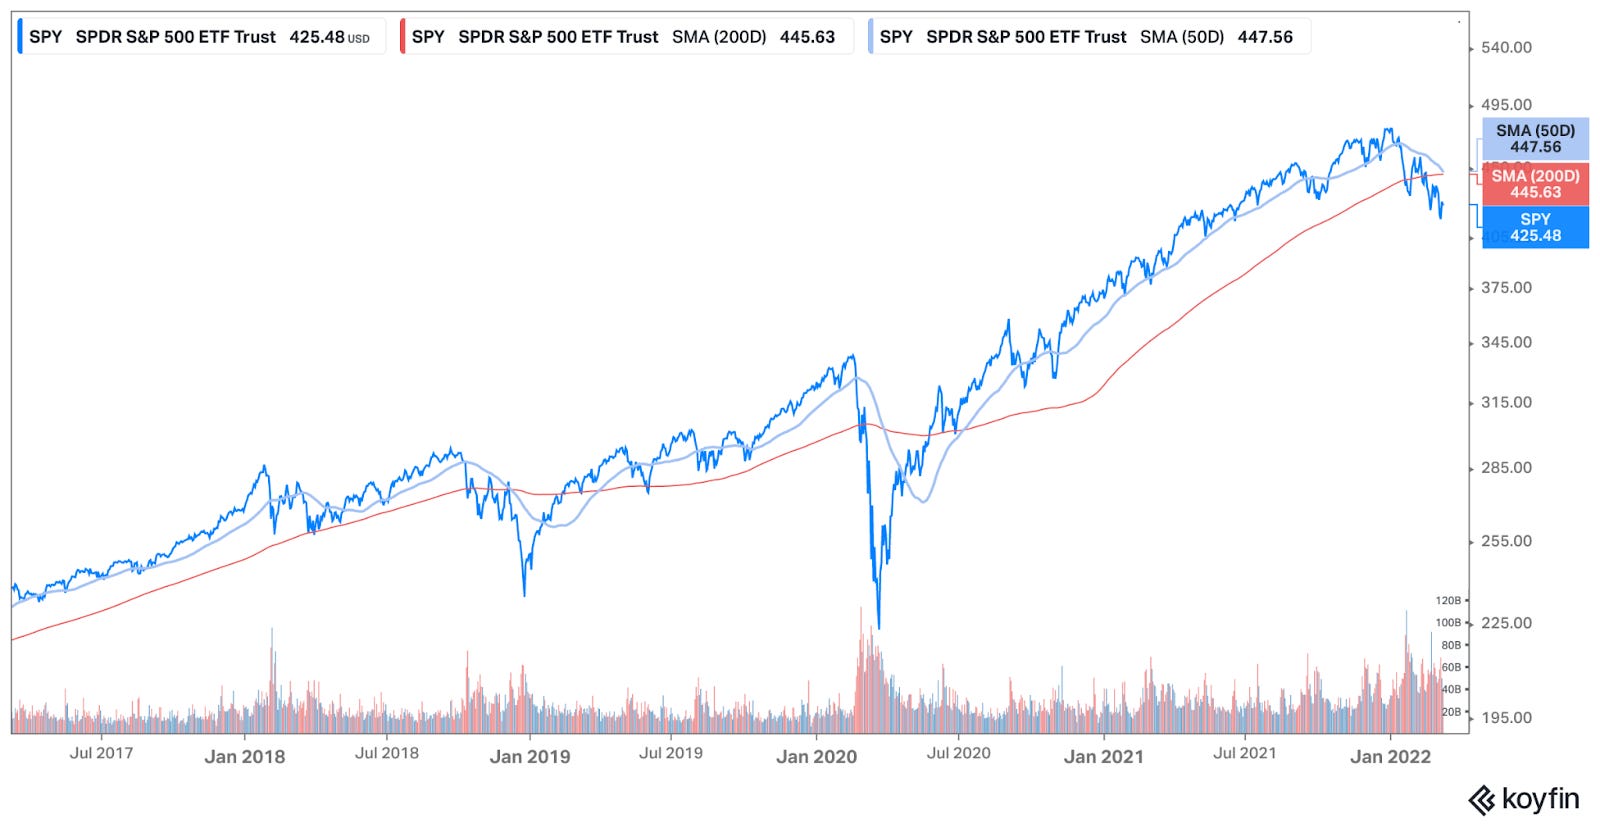
With weakness beginning in November, the current downdraft has reached levels rarely seen over the last 10 years. The Nasdaq has only experienced two drawdowns greater than todays.
Sectors

Energy (XLE) stands out as a clear leader this year, up roughly 40% year-to-date.
Surprisingly, Materials (XLB) is not quite keeping up.
Consumer discretionary (XLY), Technology (XLK), and Communications (XLC) have been rounding out the bottom with losses of roughly 15-16%.

Even after recent weakness, Technology (XLK) and Consumer discretionary (XLY) are the leading performance over the last five years.

Global markets
The top five performing global markets year-to-date are Peru (+25.1%), Brazil (22.3%), Chile (+15.9%), Colombia (+15.9%), and Qatar (+15.8%).
The bottom five performing global markets year-to-date are Russia (-81.2%), China (-16.9%), Germany (-16.2), Italy (-16%), France (-15.5%).

Performance over the last five years is shown below.

Crypto

Bitcoin seems to be weathering the recent storm better than Ethereum.

However, over the last five years, Ethereum has greatly outperformed Bitcoin.

Commodities
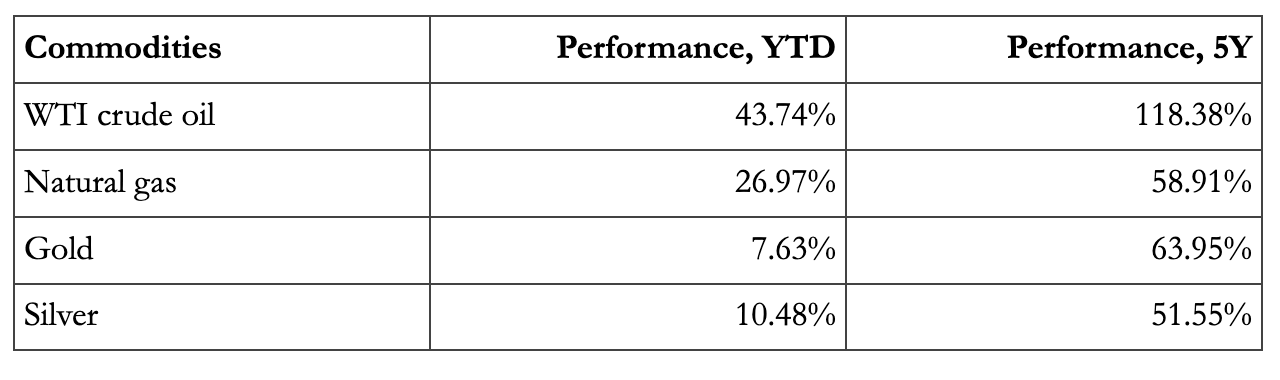
Oil has spiked this year, reaching a peak of roughly $125 with the ongoing geopolitical uncertainty.
The price is up over 40% year-to-date. Rapid price changes in a systemic resource can create ripple effects throughout the rest of the economy.

Over the last five years, the prices of oil, natural gas, gold, and silver have seen upwards movement.

Economy
Employment
Employment continues to climb back from the COVID crash.
Today, the employment ratio stands at 59.90%, still providing room to grow to reach the prior peak of 61%. The upwards trend is a positive signal for the economy. In contrast, a decrease in the employment ratio has historically been a leading indicator of a slowing economy and poor markets.

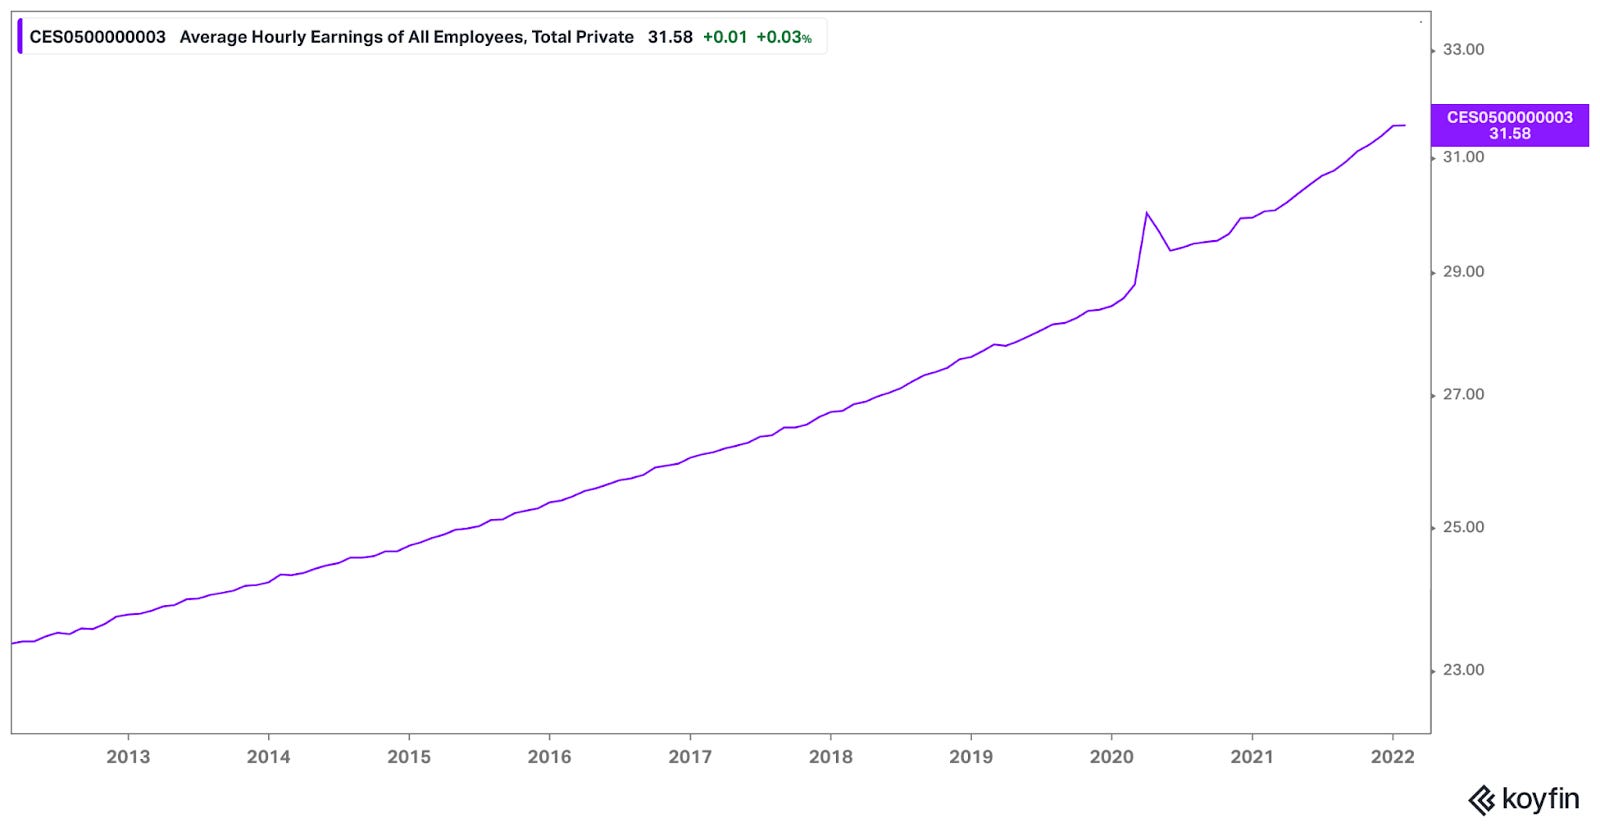
Wages
The average hourly earnings have steadily increased over the years.
Housing
Housing prices have spiked since the pandemic hit.
Prices continue to increase, with the median sale price hitting nearly $375,000, up from roughly $305,000 five years ago.

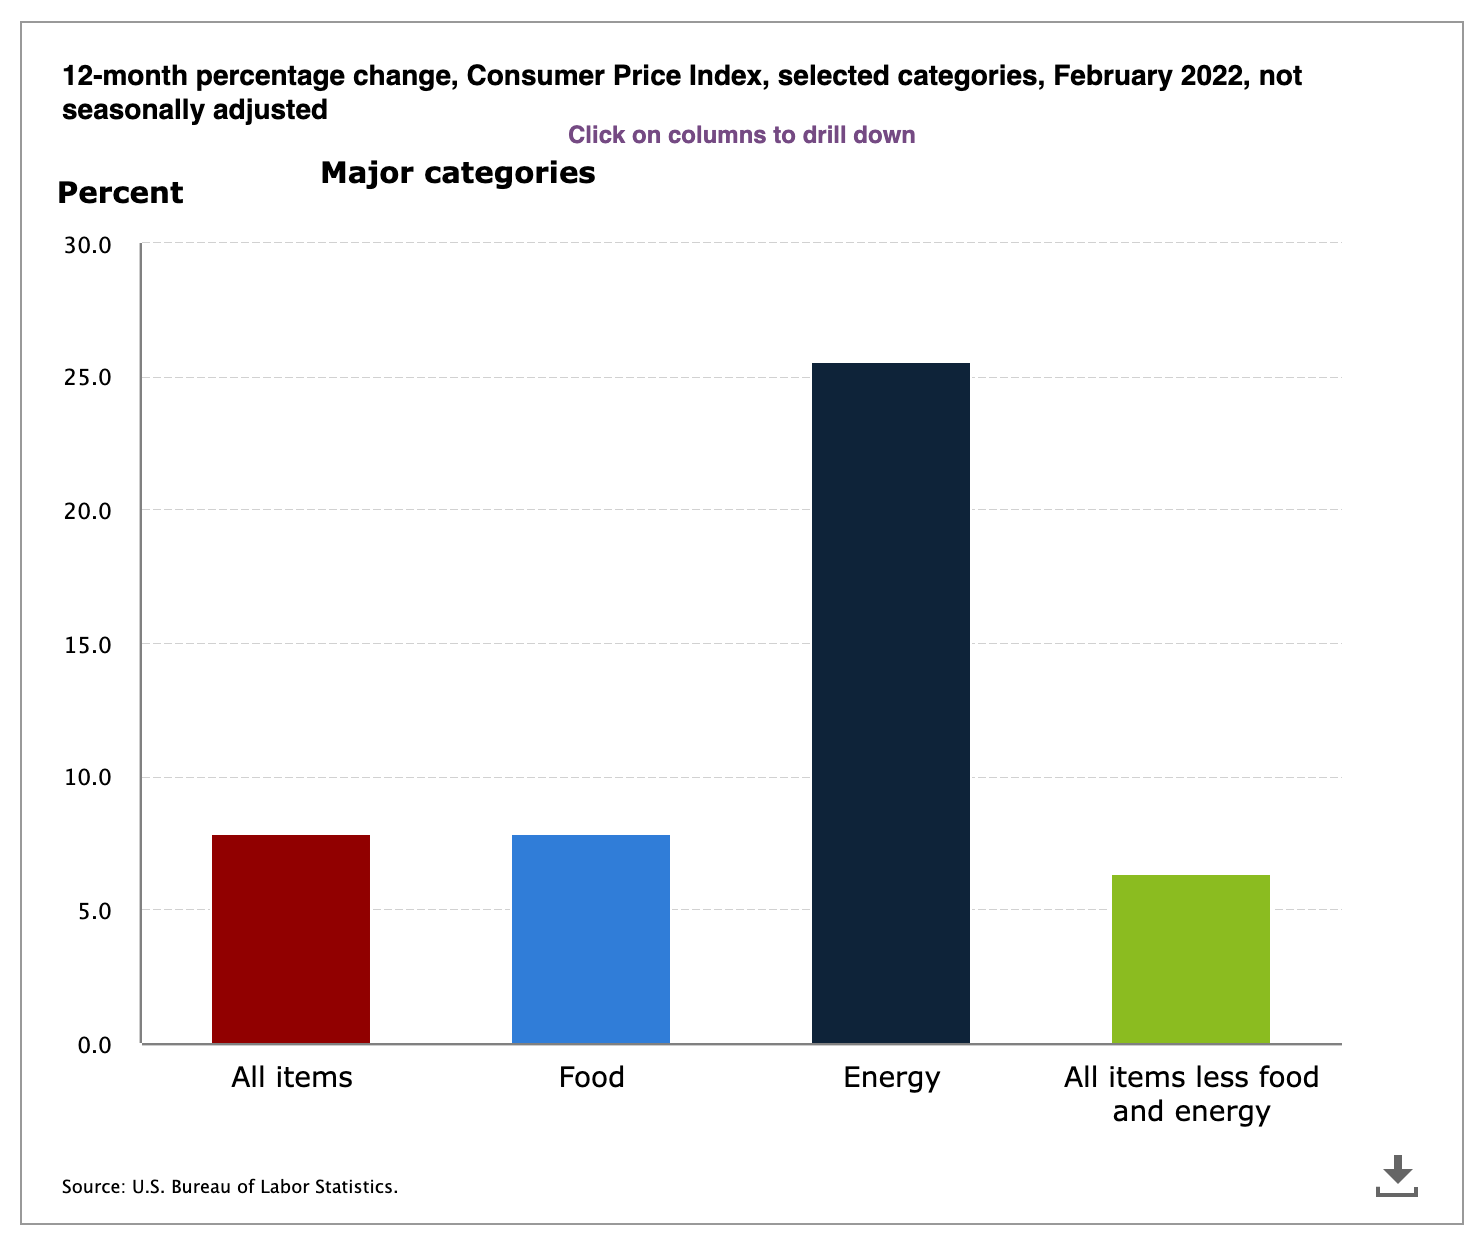
Inflation
Inflation reached 7.9% in February 2022, the highest rate going back to January 1982 when inflation was 8.4%.

Source: 12-month percentage change, Consumer Price Index, selected categories
Breaking it down by category: energy prices are up 25.6%, food prices are up 7.9%, and other items are up 6.4%.
Source: 12-month percentage change, Consumer Price Index, selected categories
Federal funds rate
The federal funds rate refers to the target interest rate set by the Federal Open Market Committee (FOMC). It is the target rate at which commercial banks borrow and lend their excess reserves to each other overnight. The FOMC meets eight times a year.
The dot plot shows a dot for where each Fed official expects rates to be at the end of a given year.
As shown below, officials expect to end 2022 with three 0.25% raises, reaching a target of 0.75-1% from today’s 0-0.25% current target.

Source: Countdown to FOMC: CME FedWatch Tool
Yield curve
The spread between short-term and long-term yields has narrowed significantly.
Treasuries with 2-year and 10-year durations currently yield 1.742% and 1.997%, respectively.
Short-term yields are seeing upwards pressure from the upcoming rate hikes.
However, over the long-term, the market expects current issues to be resolved with minimal impact.
The spread between the 2-year and 10-year yields is an important indicator to watch. Yield inversion (when short-term yields are higher than long-term yield) has historically been a rather accurate indicator of an impending recession.

Investor sentiment
Not surprisingly, investor sentiment has dipped in the last few weeks.
In the final weeks of February, bearish sentiment peaked at 53.7%, significantly above the 30.5% historical average.
While there was a brief recovery in early March, sentiment seems to be see-sawing.

Source: AAII Investor Sentiment Survey
Consumer confidence
“The Consumer Confidence Survey reflects prevailing business conditions and likely developments for the months ahead. This monthly report details consumer attitudes, buying intentions, vacation plans, and consumer expectations for inflation, stock prices, and interest rates.”
After nearly a complete recovery to pre-pandemic levels, consumer confidence has dipped.

Source: US Consumer Confidence
Fear and greed index
CNNMoney’s Fear & Greed Index looks at seven indicators including momentum, strength, breadth, put/call activity, bonds versus stocks, and more. These indicators are equally weighted and consolidated into a single index.
Today, the index is showing extreme fear.

The index is at a rather extreme level, rivaling the fear recorded during the early days of the pandemic.

Source: Fear & Greed Index - Investor Sentiment - CNNMoney
Conclusion
With investing, it is important to not over-index on any single data point. Investors are best served by assessing and interpreting as many data points as possible, looking to better understand any notable trends or patterns.
A regular review of the macro situation can provide an important lens for investors, hopefully enhancing their decision-making process.
--

Torre Financial is an independent investment advisory firm focused on emerging and established compounders.
Federico Torre
Torre Financial
federico@torrefinancial.com
https://torrefinancial.com
Disclaimer: This post and the information presented are intended for informational purposes only. The views expressed herein are the author’s alone and do not constitute an offer to sell, or a recommendation to purchase, or a solicitation of an offer to buy, any security, nor a recommendation for any investment product or service. While certain information contained herein has been obtained from sources believed to be reliable, neither the author nor any of his employers or their affiliates have independently verified this information, and its accuracy and completeness cannot be guaranteed. Accordingly, no representation or warranty, express or implied, is made as to, and no reliance should be placed on, the fairness, accuracy, timeliness or completeness of this information. The author and all employers and their affiliated persons assume no liability for this information and no obligation to update the information or analysis contained herein in the future.