


Market, Earnings, & Abbott (ABT) - July 20, 2024
Market commentary, portfolio company earnings results, and a deeper look into Abbott (ABT)

Every two weeks we share a review of the market, any earnings results, and a deep dive into one portfolio company. Subscribe now to follow along.
Market

After climbing higher, the market appears to be showing some cracks. The index closed lower 3 days in a row. Although not rare historically or cause for concern, it does appear to be a change in current sentiment.
The market continues to be in an uptrend, holding firmly above both the 50 and 200-day moving averages.
The 550 level is a critical marker. It would be bullish if the market is able to bounce back and sustain above 550. If it falls below, the next level of support would be at 525 – a further decline of 5%.
Year-to-date performance across indices:
Nasdaq +23%
S&P 500 +21%
Dow Jones +15%

The S&P 500’s valuation is stretched, reaching levels not seen over the last 10 years. Markets could stay overvalued for a long time, but valuations do tend to revert to the mean.

As a market-capitalization weighted index, the S&P 500 is very heavily influenced by the largest companies. Many of the largest companies including NVDA, MSFT, AAPL, amongst others are themselves trading at stretched valuations.
NVDA:

AAPL:

MSFT:

The growth outlook for these mega caps is clearly positive and optimistic. However, it is difficult for trillion-dollar businesses to sustain extraordinary growth rates for long periods of time.
Earnings have been very strong for the Magnificent 7, especially when compared to the rest of the S&P 500. Earnings are starting to even out, with the rest of the group moving into positive earnings growth.

Additionally, mega caps have been safe havens in a high inflation & rising rate environment. With pricing power and huge cash hoards, they have been benefiting from strong cash flows and interest payments on their cash.
The latest CPI inflation report showed prices declined 0.1% month over month for June. Government reported y/y inflation came in at 3%, while Truflation’s real-time index shows 1.88%. This was very welcomed by the markets and has served as a catalyst for change, alongside the start of a new quarter.

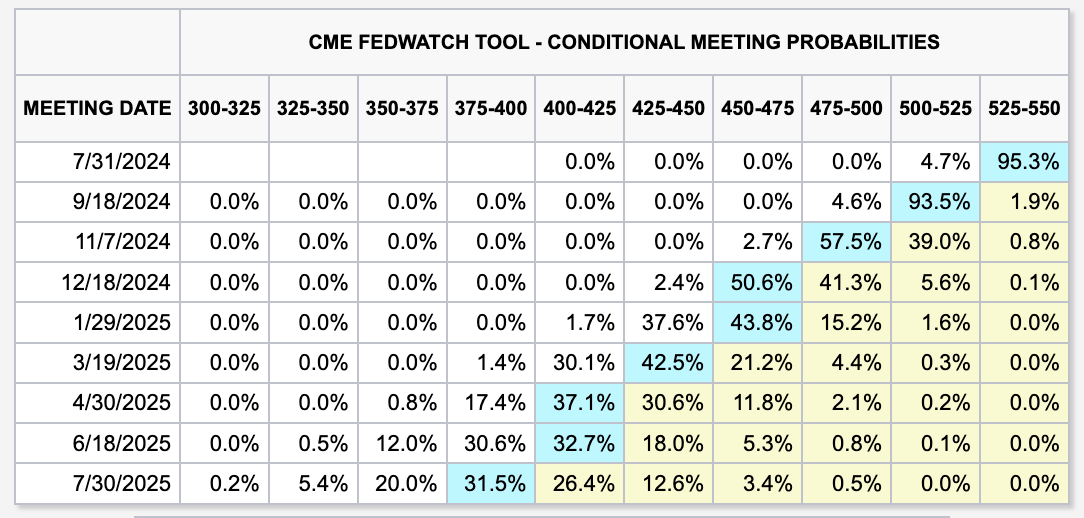
Markets are pricing in a September rate cut with a probability of 93.5%. Lower interest rates are most beneficial to smaller businesses that require capital to grow.
Market rotation seems to be in full swing.

Over the last 10 days, the Nasdaq which is heavily influenced by the tech mega caps is down almost 2.5% while the Russell 2000 which is mostly small businesses is up 8%.

Similarly over the last 10 days, value (+4%) is outpacing growth (-2.8%).

Looking at specific sectors, real estate is leading (+6.3%) and technology is lagging behind (-3.4%)

Real estate investment trusts, REITS, are often seen as fixed income alternatives. They are particularly sensitive to rates as investors compare yields to risk-free alternatives. Underlying assets valuation fluctuates with rate changes – as rates drop, prices increase, and vice versa. Capital is also required for growth.
Agree Realty (ADC) and American Tower (AMT), two high-quality REITs and portfolio companies, have shown relative strength.

Agree Realty (ADC), focused on triple net leases with high quality tenants, could be the most sensitive to changes in rates. Shares currently pay $3 per year and at a price of $66 would yield 4.5% going forward. ADC has grown the dividend ~6% per year over the last 10 years.
Over the last year the fed funds rate has been at 5.3%. ADC traded between 55-60 for the majority, yielding between 5.0-5.5%.
If rates come down to 4.3% over the next year, it is likely that investors could bid ADC up to a comparable yield. For ADC to be priced at a 4.0-4.5% yield after a dividend increase, shares would have to be trading between $70-80.
ADC is one specific case study, yet illustrative of the broader forces at play. As interest rate cuts become more and more of a reality, the rotation is likely to continue. For the back half of the year, it is possible for indices to be flat as money rotates.
Earnings
Two portfolio companies reported earnings over the last 2 weeks.

* Abbott financials are pending, 10-Q is yet to be released
Next week, we will hear from 7 portfolio companies: GOOGL, V, DHR, MCO, ADC, NOW, and EW.
Abbott (ABT)
Prior coverage:
Abbott is a diversified healthcare company, with a mission to help people live more fully.
Founded over 100 years ago, the company has weather all storms and adapted as necessary.
The company has an impressive record of shareholder returns. Abbott has one of the highest cumulative returns of any publicly traded company, delivering a compounded 13.85% over nearly 87 years!

Abbott operates under four segments.
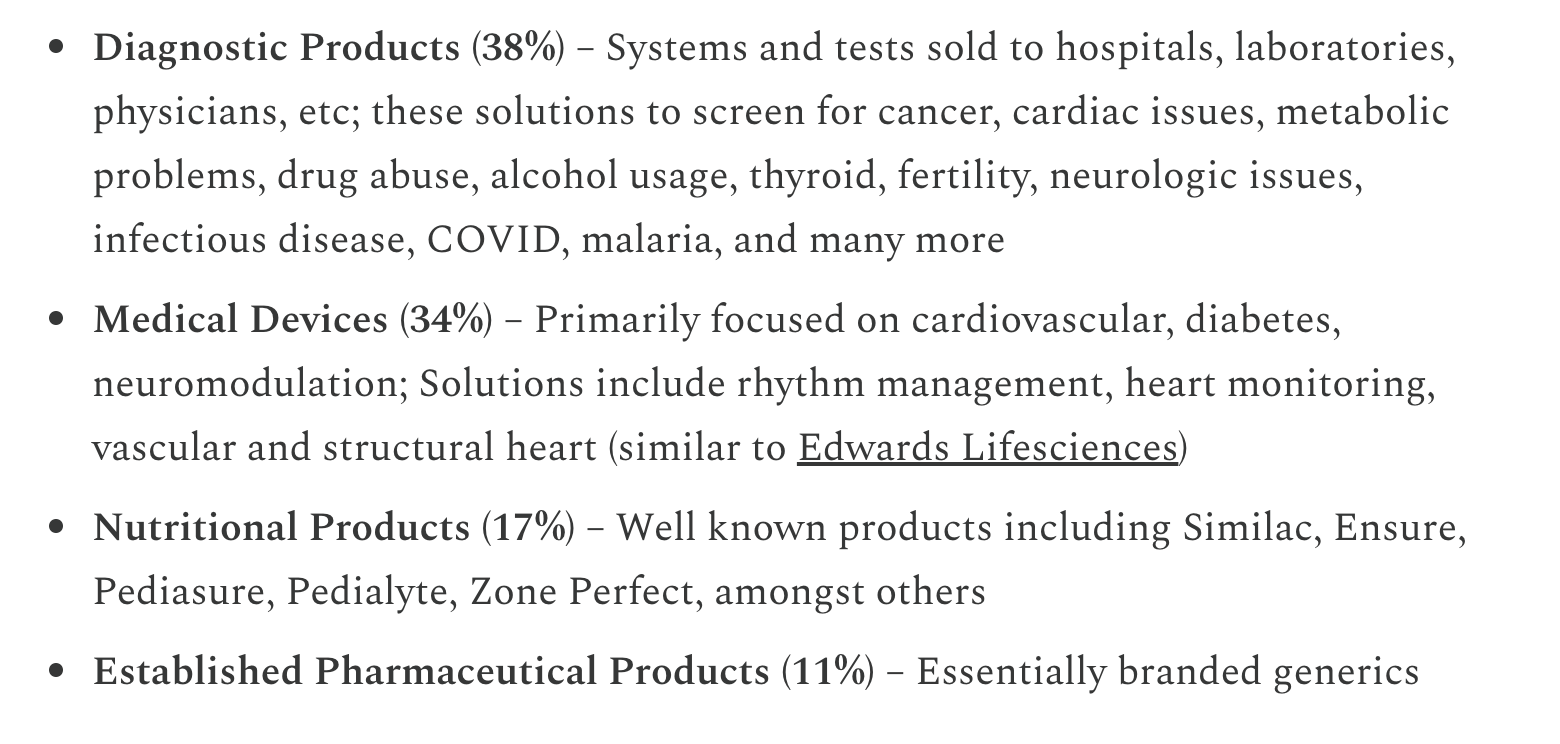
As part of their diagnostic segment, Abbott sells COVID tests. They were a huge beneficiary during the pandemic. That tailwind, however, has turned into a headwind as the world has normalized.
Revenue growth has been lower than expected primarily due to lower COVID testing sales.
They are now getting past those comps and are showing accelerating growth, up 4% y/y for the quarter. Excluding pandemic related revenue, revenue would be up 9.3%.
In their earnings report, Abbott raised full year EPS guidance and called for organic sales growth (excluding COVID) to accelerate to 9.5-10%.
Abbott continues to innovate across all segments: launching and getting approval of surgical & medical devices, expanding in consumer markets with new glucose monitoring systems, and continuing to invest in R&D to maintain a pipeline of new product approvals and treatment indications.
Healthcare is a great industry to be in – resilient and non discretionary. Demand is stable throughout all periods, as health is the last thing anyone would want to sacrifice. Abbott is an extraordinary operator with a proven track record, and going for a very attractive valuation in the midst of market extremes.
Diving into the financials:

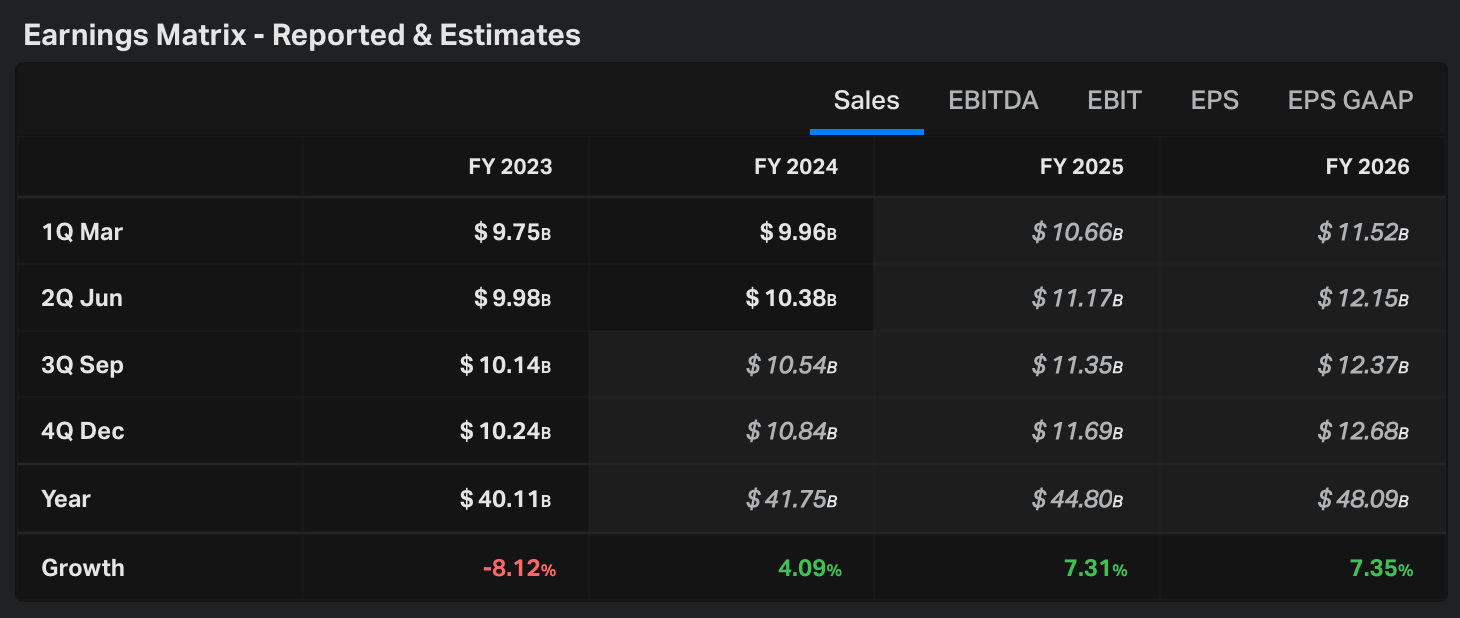
TTM revenue accelerated up to 1%, establishing a very positive trend after the double digit declines a year back. Quarterly revenue is up 4% y/y, showing signs of the acceleration continuing.
TTM gross margin has held steady at 55%. The most recent quarter showed an uptick to 56%, which may be normal fluctuation, but positive nonetheless
TTM EBITDA margin came in at 27% for the most recently available data; it is a bit short of the 30s reached in the testing boom, but may be closer to the true stable state
TTM FCF margin was 12% in Q1, again a decline but not unexpected after the high margin COVID testing sales
Balance sheet is healthy, with 6.6b in cash and 14b in debt. TTM FCF is approximately 5b; debt being less than 3x FCF is very serviceable and not a concern. Debt levels have been stable over the last few years.
Shares outstanding are unchanged y/y. Historically, shares outstanding have been declining.
Efficiency metrics look strong, with 36% and 16% for EBITDA ROIC and FCF ROIC respectively.
We’ve started subtracting goodwill from our ROIC calculations. For more details, see https://x.com/ftorre104/status/1813555860922380653
As for valuation:

Shares trade for 4.2x revenue or 16.2x NTM EBITDA. Those are very reasonable levels for such a high quality company. Although growth is currently muted, there’s a very real opportunity for that to increase over the next few years..
Analysts expect revenue growth to get up to 7%+.
EBITDA is expected to reach double digit growth rates.

The following table shows possible annualized returns over the next 5 years across various scenarios. The model assumes annual share reduction of 1%.

Over the next 5 years, investors could expect between 6-12% annualized returns.
Fast Graphs provides another perspective.

If shares were to trade at the normal multiple of 24x in the near future, shares could move up to $136. An investment at today’s price could return 15% per year.
Taking a look at the price action:

Shares have been under pressure throughout Q2 2024, as big tech and AI continued to absorb the market. The technical picture is not great, with shares trading below both the 200-day and 50-day moving averages.
That being said, it does seem like there is some accumulation going on in the 100-105 range. If shares are able to make it over 104-105, that could turn into strong support and help share move upwards.
Closing
“It's not a stock market. It's a market of stocks.”
During the back half of the year, it will be even more important to choose investments wisely. Abbot is a great example of a durable and resilient company trading at an attractive valuation.
The index appears to be stretched, and, in our opinion, exhibits more downside risk than upside opportunity. That being said, we feel very comfortable with our portfolio holdings.

Our TF portfolio has a FCF yield of 4.1% or 24x FCF, compared to 3.1% or 32.3x for the index.
Our TF portfolio exhibits stronger margins across the board.
We’re more diversified, with less concentration in top positions and more exposure to other resilient industries including healthcare, risk management, and more.
While we’d be worried about the downside of being invested in the index, we are very comfortable with our holdings.
–
Torre Financial is an independent investment advisory firm focused on companies with high return on capital, competitive advantages, and durable growth. Our approach is to stay invested in equities: over time, equities generate the best returns.
Federico Torre
Torre Financial
federico@torrefinancial.com
Disclaimer: This post and the information presented are intended for informational purposes only. The views expressed herein are the author’s alone and do not constitute an offer to sell, or a recommendation to purchase, or a solicitation of an offer to buy, any security, nor a recommendation for any investment product or service. While certain information contained herein has been obtained from sources believed to be reliable, neither the author nor any of his employers or their affiliates have independently verified this information, and its accuracy and completeness cannot be guaranteed. Accordingly, no representation or warranty, express or implied, is made as to, and no reliance should be placed on, the fairness, accuracy, timeliness or completeness of this information. The author and all employers and their affiliated persons assume no liability for this information and no obligation to update the information or analysis contained herein in the future.