


Market, Earnings, & Lennox (LII) - May 10, 2025
Market commentary, portfolio company earnings results, and a deeper look into Lennox (LII)

Every two weeks we share a review of the market, any earnings results, and a deep dive into one portfolio company. Subscribe now to follow along.
Market
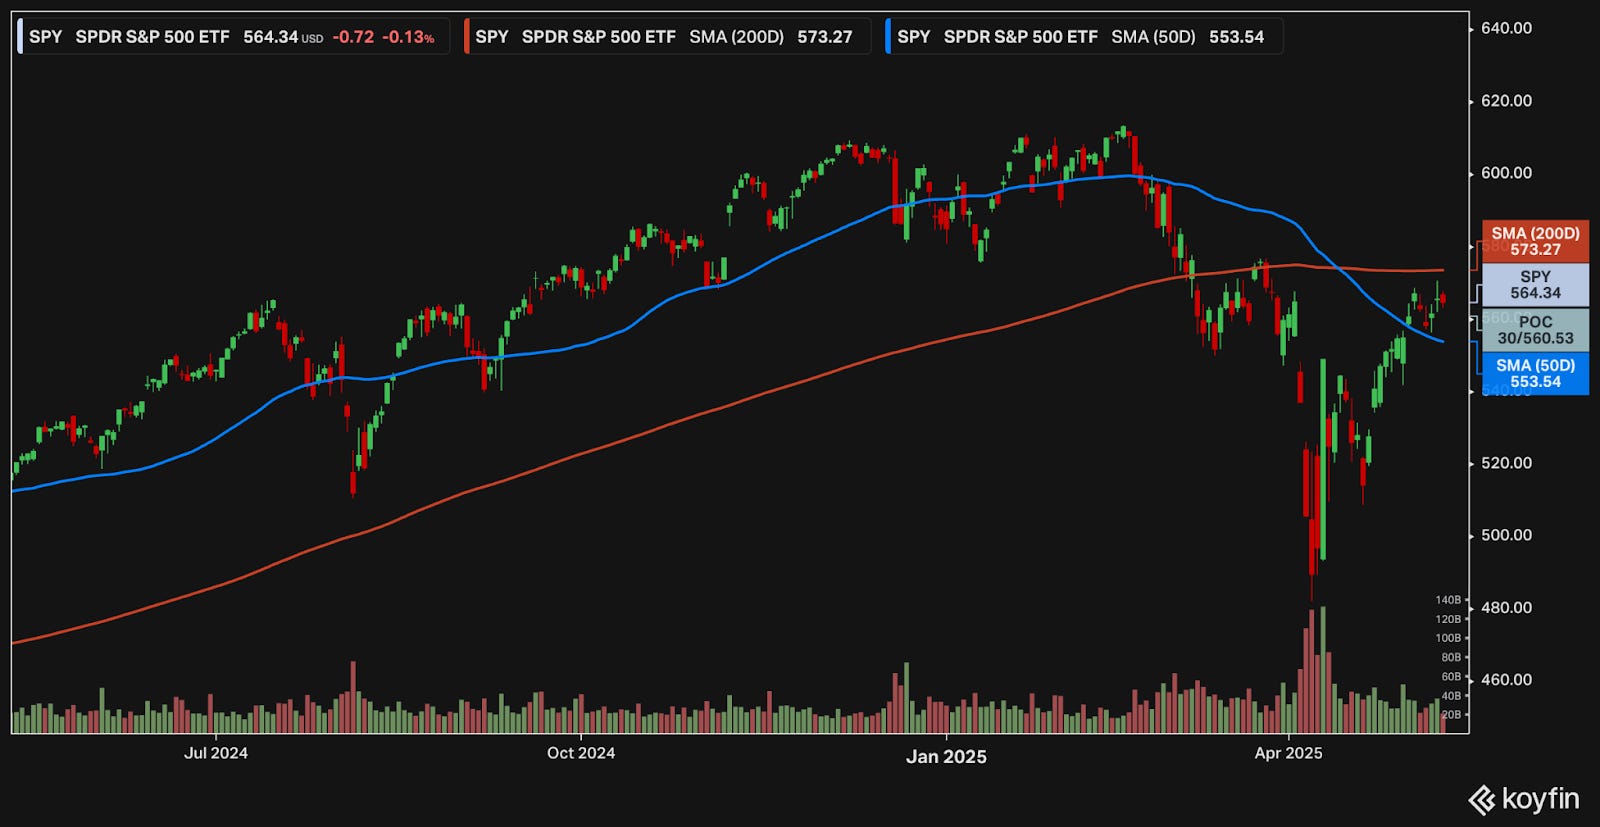
After a strong recovery, the S&P 500 has reclaimed its 50-day moving average. While the technical picture is starting to improve, the index is still down 7.7% from the peak set at the end of February.
The SPY index ended the week at 564. The next big test for the bulls will be around 575, near the 200-day moving average and the local peak set in March.
The subdued volatility and recent strength can lure investors in. It’s unknown whether the recovery will truly be V-shaped or if the market will pull back and re-rest the lows. Given all the recent uncertainty, it may be best to stay cautious.
Year-to-date performance across indices:
S&P 500 -3.77%
Nasdaq -4.52%
Dow Jones -3.04%

The Trump Administration’s hard stance on global trade and tariffs rattled the world.
Recently, the tone has softened, leading to increasing optimism. Exemptions were granted for certain sectors. A deal framework with the UK was announced. The US and China are coming to the table this weekend.
The market has rallied on the positive notes. The S&P 500 was up 9 days in a row, the longest streak in over 20 years. It has been green in 11 of the last 14 trading days.
Volatility has come down significantly. The VIX index declined 63%, from a peak of 60 to 22.

The VIX has marked a historical record — the 2nd fastest decline in the volatility index. Forward returns after such an event have historically outperformed normal times.

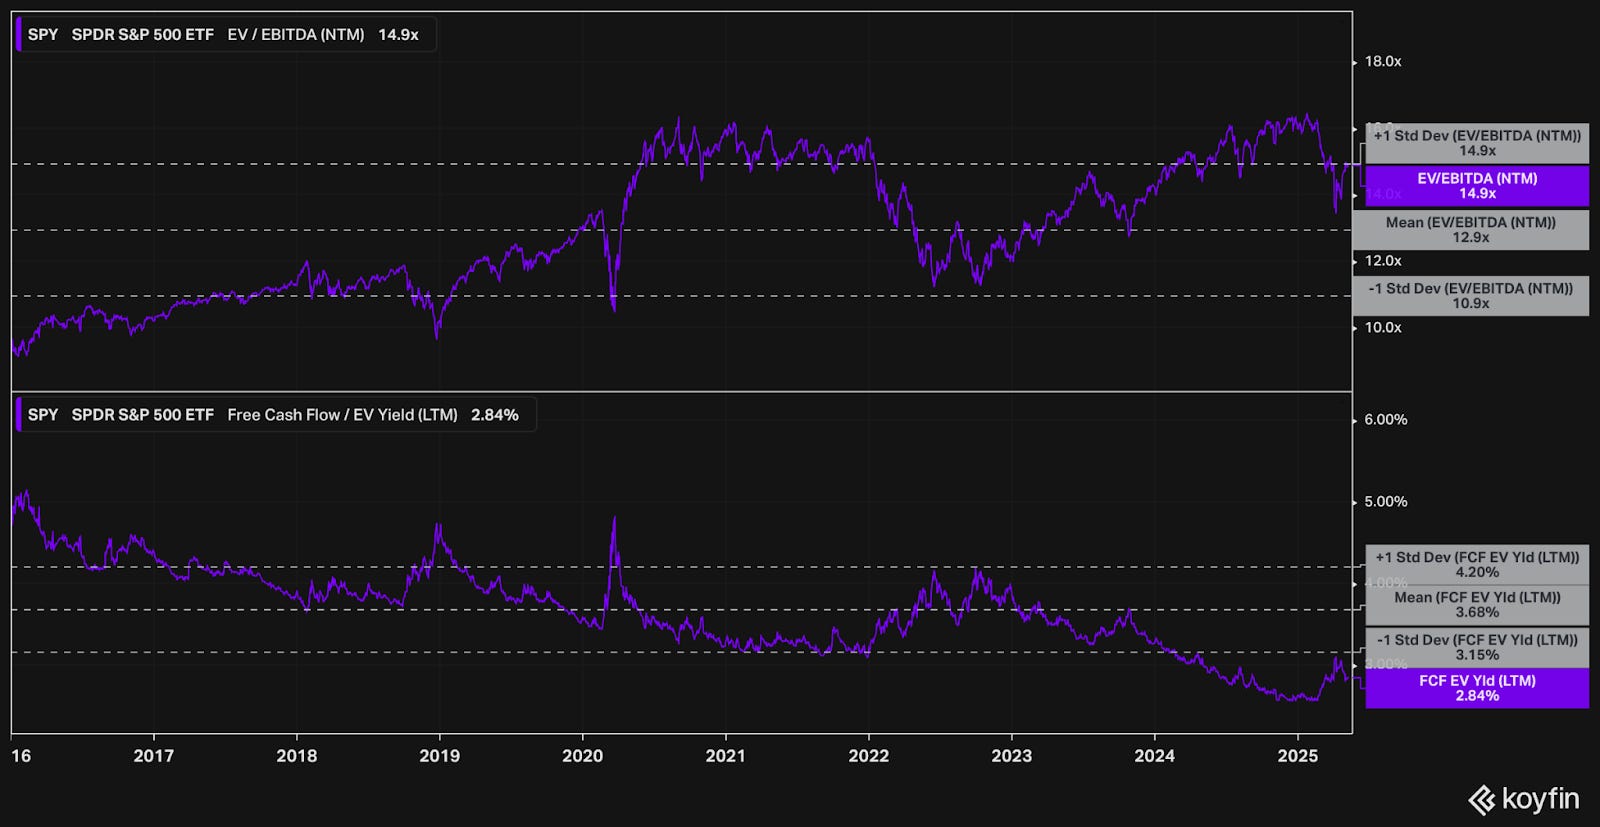
Turning towards valuation, the S&P 500 index is currently trading towards the high range of its 10-year means for both NTM EV/EBITDA and FCF yields — not particularly cheap.
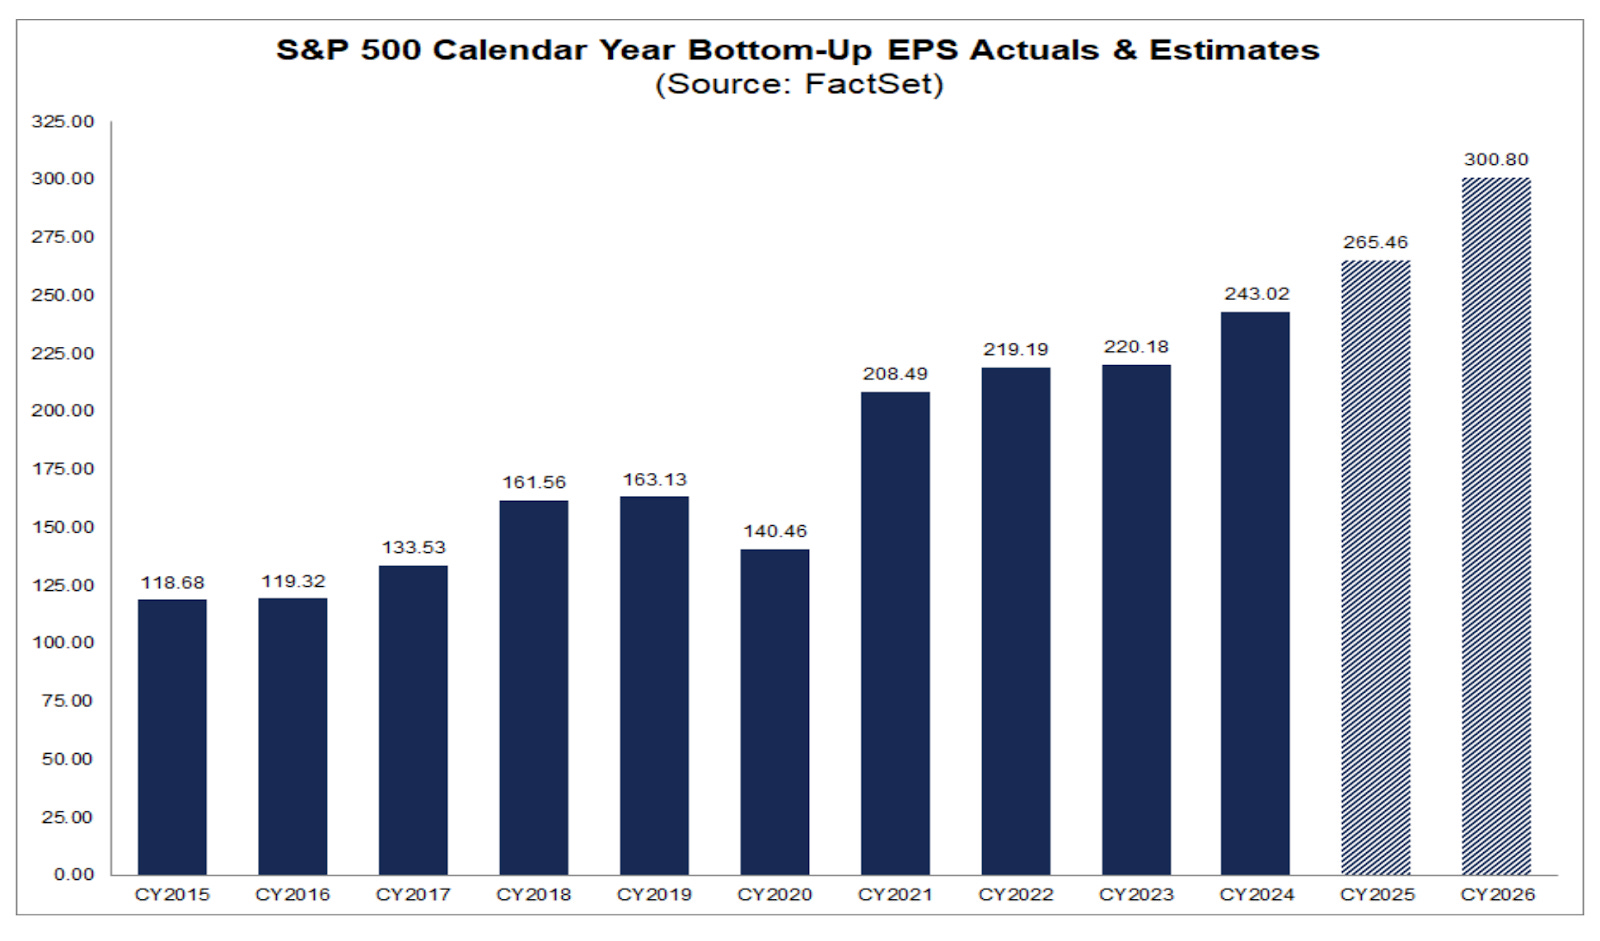
Driving some of the optimism is the expectation of increasing earnings in the coming years. The S&P 500 earned $243 per share for 2024. Estimated EPS for 2025 jumps to $265 (+9%) and then to $301 (+14%) for 2026.
Looking out a few years, SPY, the S&P 500 ETF, could return ~7% per year if it continues to trade at its historical multiple of 19.8x. However, if the multiple compresses slightly to 18x, returns would be closer to ~3.4% per year.

The dollar has weakened significantly throughout the year – likely intentional by the current administration. The dollar is down 9% from the previous peak. A weaker dollar incentivizes international sales and exports.
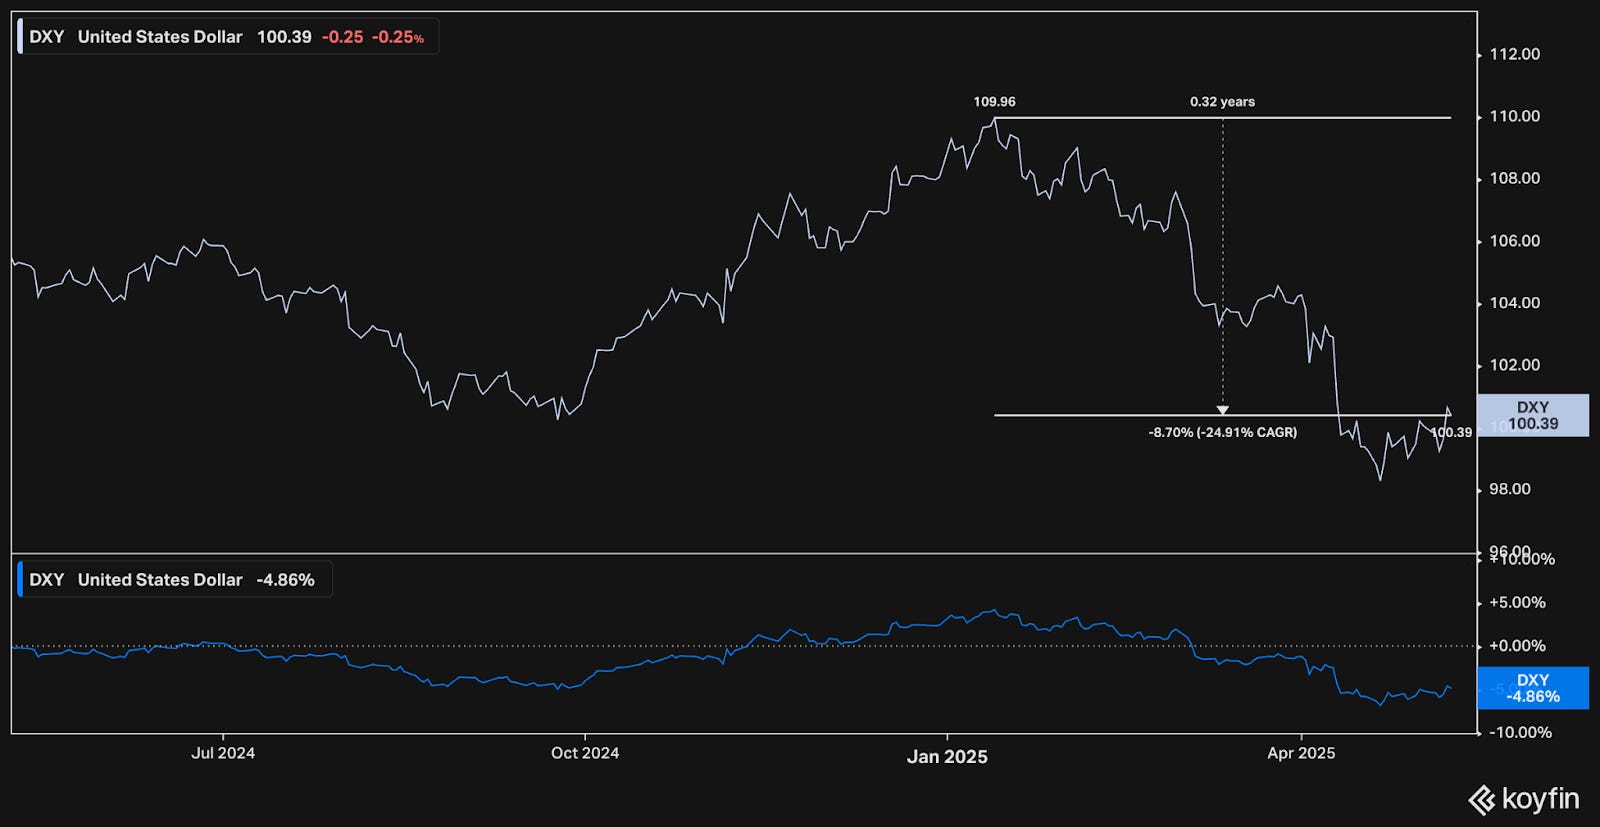
FactSet estimates that 40% of the S&P 500’s revenue comes from international sales.

Crude oil prices have declined 23% over the last year, likely due to the global instability and concerns of a slowing economy.
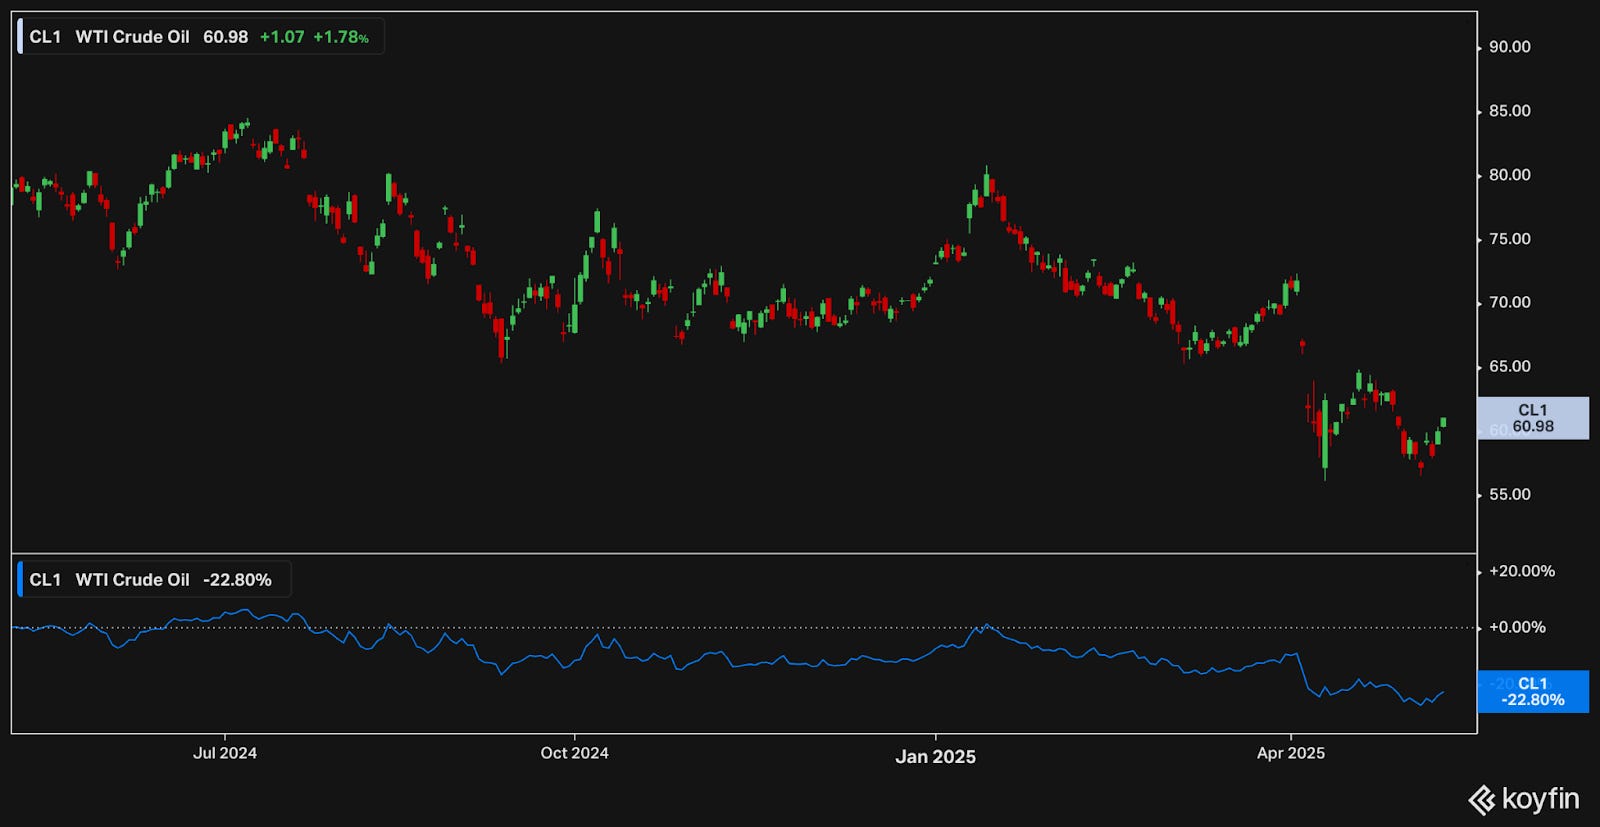
Crude oil is a key input into inflation, since transportation is critical for moving people and goods.
Truflation, a real-time inflation index, validates that inflation has come down significantly and is now materially below the Fed’s target. The Fed, however, has to grapple with the step-change price effects of tariffs as they come into effect.

The bond market has been relatively stable recently with the US 10-year at 4.4% and the 2-year at 3.9%. The yield curve continues to widen.
The administration has been very vocal of their intention to bring the US 10-year yields down. The US 10-year yields serve as the index for many practical applications such as mortgages, business loans, and more.

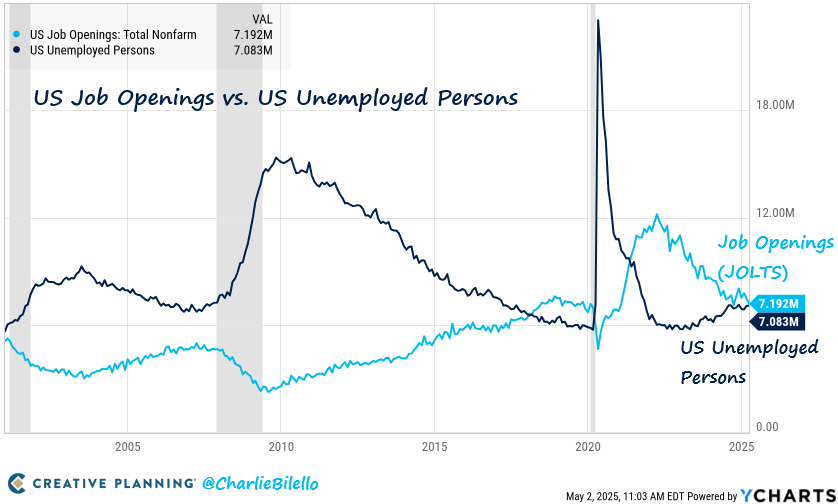
The other side of the Fed’s mandate is to achieve maximum employment. The job market has been very healthy and resilient. There continue to be more job openings than unemployed persons. That gap, however, has closed significantly, indicating softening.
The combination of a healthy job market with the uncertainty around tariffs and ensuing price effects gave Powell and the Fed patience to keep rates steady in May.
The market continues to expect rates to come down throughout the year, pricing in 3 rate cuts which would end the year with rates at 3.50-3.75%.

Earnings
Over the last four weeks, 11 portfolio companies reported earnings.

Lennox (LII)

Lennox has deep roots in industrial manufacturing. Dave Lennox founded the company in 1895 as a machine repair business for railroads. It soon evolved into a furnace business, innovating with steel coal-fired furnaces which were a significant improvement over cast-iron furnaces.
In 1904, David Windsor Norris acquired Lennox. He grew the business with direct distribution to authorized dealers and utilizing the local newspaper he owned to promote his products.
In 1935, the Lennox Furnace Company expanded into residential systems, a significant step into the broader heating, ventilation and air conditioning (HVAC) market.
In 1955, the company was renamed to Lennox Industries to better reflect the expanded scope.
In 1952, Lennox established an international division as they expanded into Canada.

In 1973, Lennox acquired Heatcraft, bringing in popular brands including Larkin, Bohn, Chandler, and Climate Control.
The Norris family owned the company privately for over 95 years until their eventual IPO in 1999.
Planning to refocus on North America, Lennox sold its European divisions in September 2023.
In October 2023, the company acquired AES, a company dedicated to service and sustainability in the light commercial market.
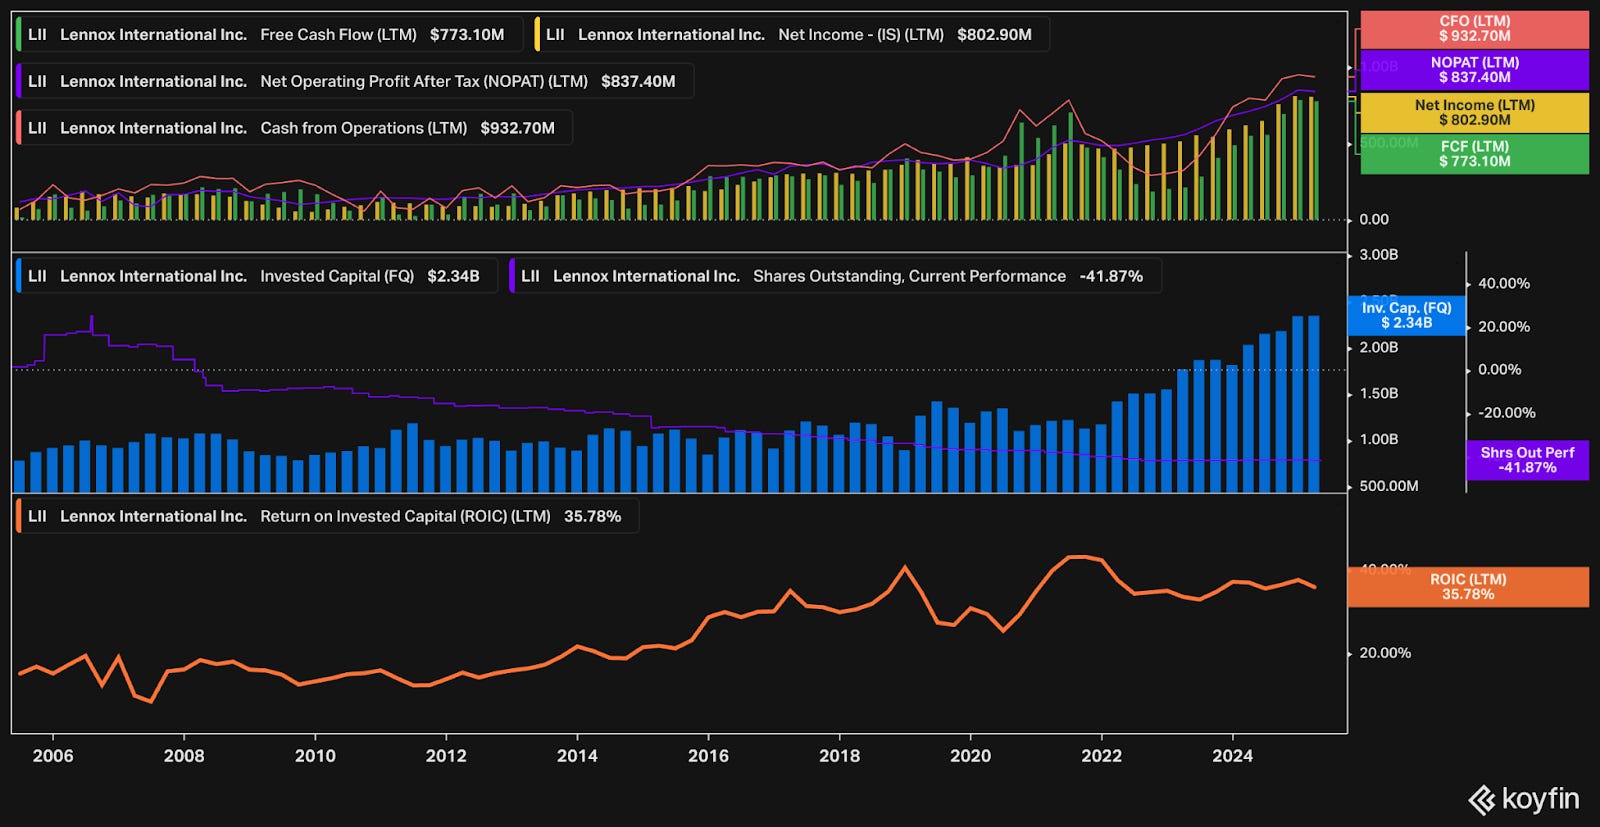
Lennox has been exceptionally well managed. Over the last 20 years, margins have consistently improved.

Over the last 20 years, net income has increased more than 11x. The company has bought back nearly half the company, reducing shares by 42%. The return on invested capital has trended higher, currently at 36%.
Lennox (LII) has compounded at a 19.89% CAGR over the last 20 years. The S&P 500 (SPY) has grown at about half the rate – 10.22% CAGR.
A $100,000 investment in LII would have become $3,764,083.
A $100,000 investment in SPY would have become $700,177.

The steady ownership of the company and management team likely has had a material positive impact on the performance over time.
Insiders own 9.73% of the company, with the majority held by John W. Norris, descendant of David Windsor Norris.
The current CEO, Alok Maskara, started on May 9th, 2022. He is only the company’s 8th CEO in Lennox’s 130 year history, since the company was founded in 1895. The long-term incentive program for Alok and other executives hinges on ROIC and net income.

Today, Lennox International Inc. is a global leader in energy-efficient climate-control systems, providing products for the heating, ventilation, and air conditioning and refrigeration (HVACR) markets.

Lennox operates two major business segments:
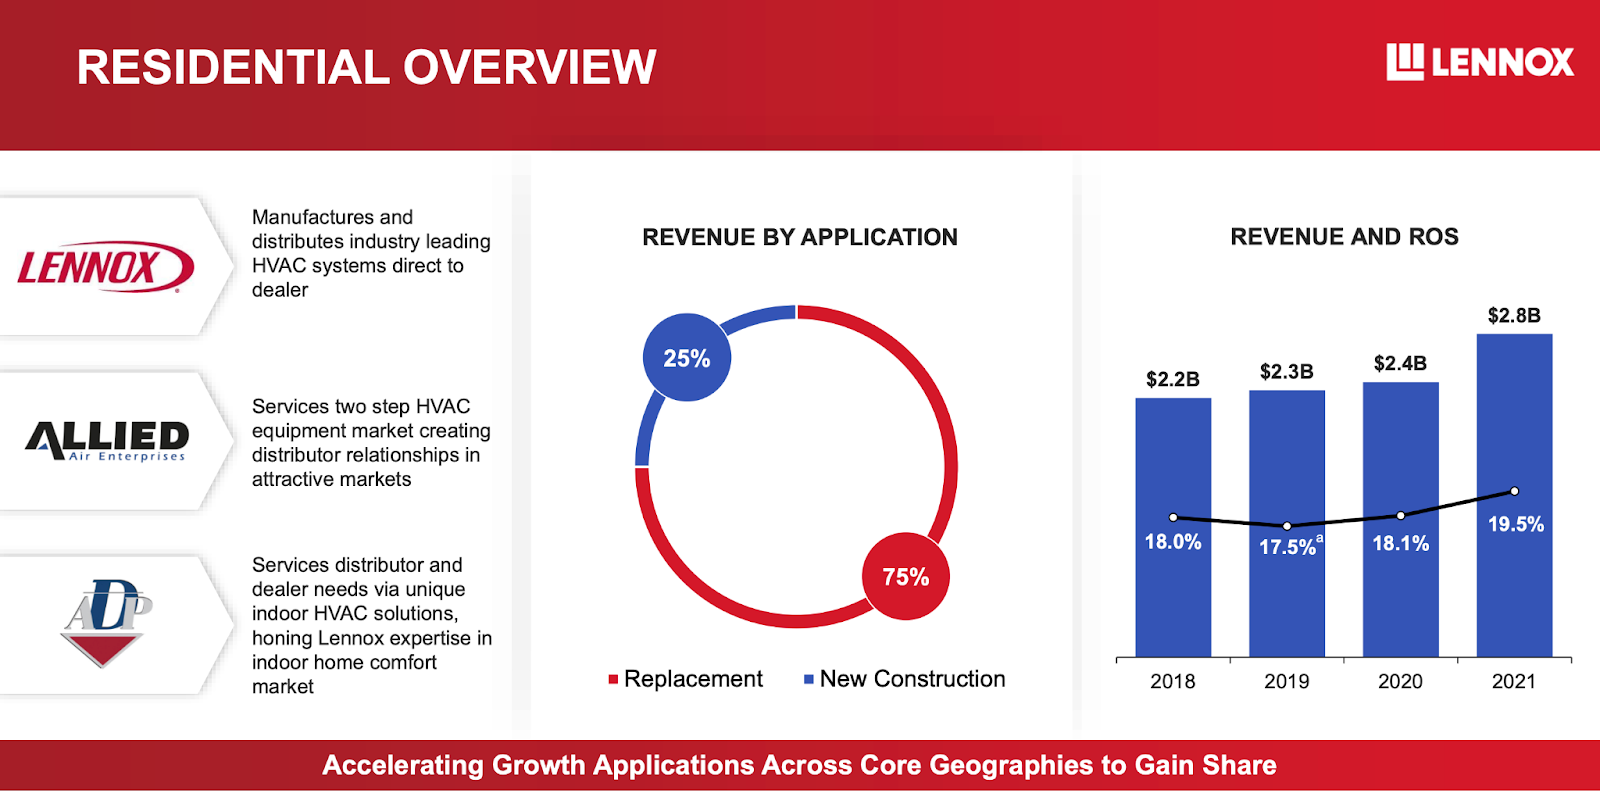
Home Comfort Solutions (~67% of sales) – furnaces, air conditioners, heat pumps, indoor air quality equipment, and more for the residential market, both replacement & new construction. Primarily sold directly to independent installing dealers.
Building Climate Solutions (~33% of sales) – heating and air conditioning equipment, systems, installation, services, and more for the commercial market, both replacement & new construction. Service and installation is a major component.
HVACR is an attractive industry. For starters, it is non-discretionary. Most houses and buildings cannot operate without HVAC.
Powerful secular tailwinds support continued growth. The US has a housing deficit of 4-5 million units, with new homes being built at a rate of ~1m/yr. Rising global average temperature has been associated with more extreme weather variation. Lennox is well positioned to continue growing and expanding alongside these trends.
Lennox’s business is able to benefit from the exposure to the cyclical housing market with subdued volatility due to their mix of new construction, replacement, and service. The majority 75% of Lennox’s residential business is replacement; only 25% is dependent on new construction.
As mentioned above, Lennox has been constantly re-assessing their portfolio of operations. By divesting their European business, Lennox is concentrating on North America.
The company is focusing on the most attractive opportunities, which include improving their distribution partnerships and profitability, growing the commercial services business such as with emergency replacement, and leveraging bolt on acquisitions.
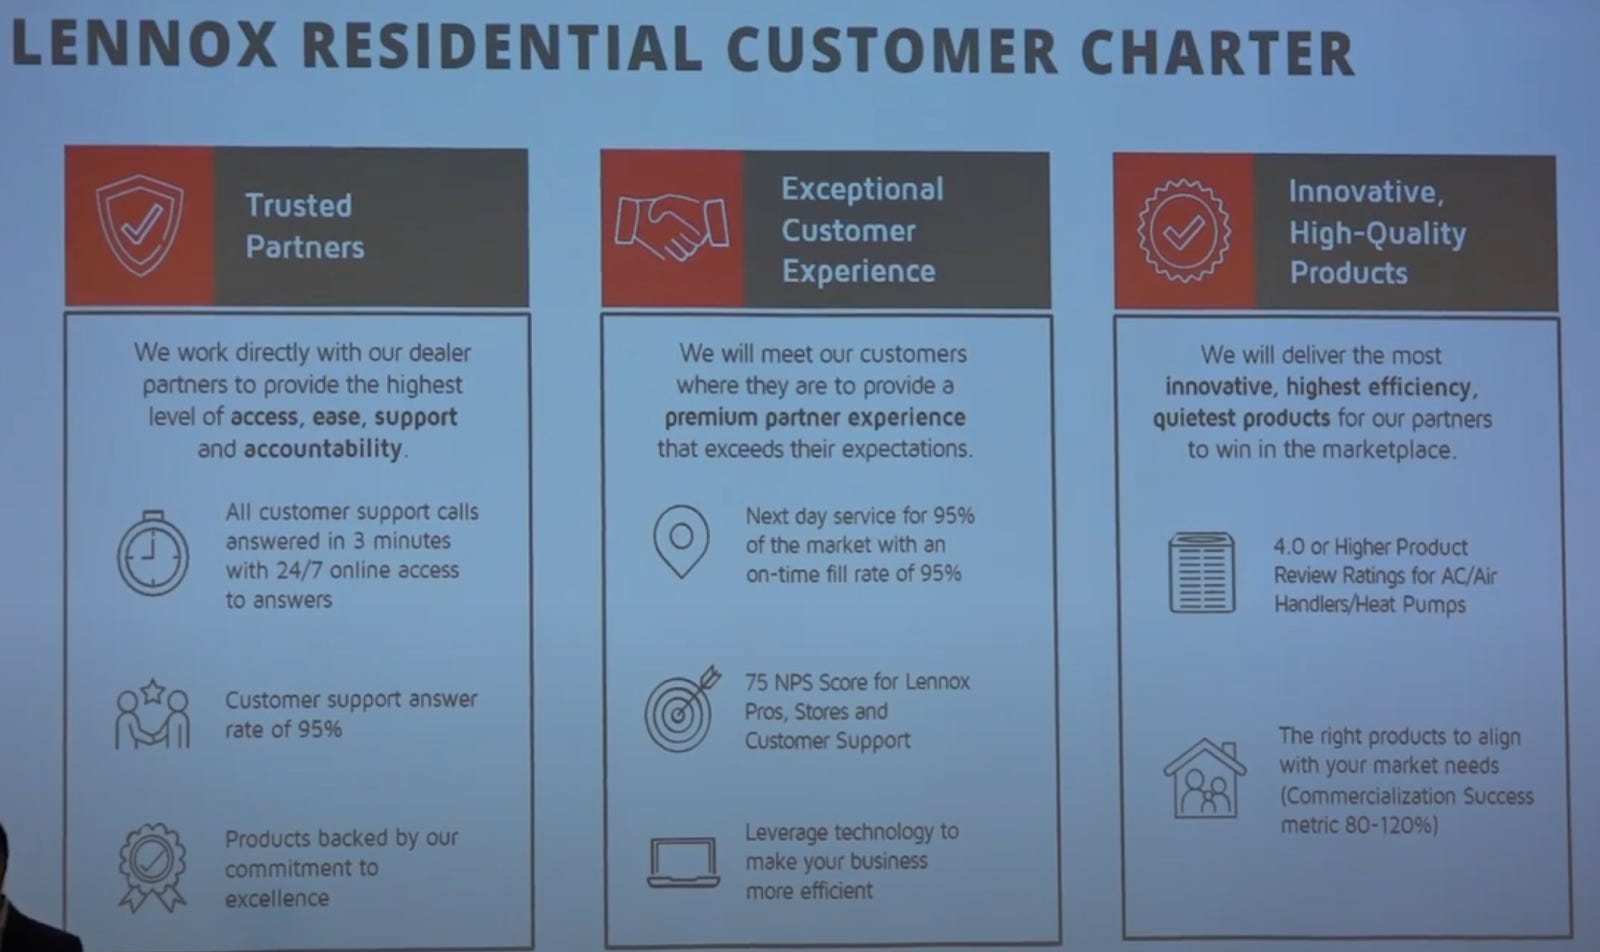
Lennox has a strong direct relationship with distributors, with about 70% of the business being direct compared to the industry being closer to 20% direct. This allows Lennox to be closer to their customers, listen to and gather feedback to improve their offerings.
Commercial services is an attractive, high margin opportunity. AES, which was acquired in late 2023, expanded their commercial offerings significantly. After running a successful pilot for emergency replacement services in 2024, Lennox is expanding the offering in 2025.
Lennox has been a superbly well-managed business with strong operational leverage and efficiency, has a strong management team with aligned interests, and is very well positioned for continued growth and expansion for many years to come.
Diving into the quarterly financials:

TTM revenue growth ticked up to 8%, up from 5% a few quarters ago. Note that management has guided for 2% revenue growth for 2025 due primarily to tariffs and related uncertainties
TTM gross margin increased to 33%, demonstrating strengths in both pricing power and operational efficiency gains
TTM EBITDA increased to 21%, trending in line with the gross margin improvement. All of the gross margin improvement has made its way through to EBITDA, which is a strong sign of operational leverage.
TTM FCF margin ticked down to 14%, seems to be primarily due to a seasonal pattern for Q1
The balance sheet is healthy, with $223m in cash and debt of $1,094m, bringing net debt to $871m. This is more than covered with 1 year’s worth of EBITDA, or 0.8x.
Shares outstanding have been flat over the last few years. Throughout 2021 and 2022, as the share price dipped, management was buying back shares aggressively.
Efficiency ratios are very strong, with ROIC of 41% and FCF ROIC of 33%.
As for valuation:

LII shares are trading for 17.8x EV/NTM EBITDA. This seems like a fair valuation for a high quality, proven operator. The current multiple is above the 10-year historical average of ~16x.
From a FCF perspective, shares yield 3.6%, more attractively valued than the historical average of 3.1%.

Looking at the next few years, revenue is expected to grow ~5-6% and EBITDA is expected to grow ~8-9%.

The following table shows possible annualized returns over the next 5 years across various scenarios. The model assumes share count declines by 1.5% per year & includes dividends.

Over the next 5 years…
If EBITDA grows at 7% CAGR and the multiple is maintained at 18x, shares could return 9.9% per year
If EBITDA grows at 9% CAGR and the multiple expands slightly to 22x, shares could return 16.7% per year
Fastgraphs provides another look:

If the current P/E multiple (25.3x) were to compress to the historical average (24x) over the next few years, shares could produce returns of nearly 7% per year.
–
Torre Financial is an independent investment advisory firm focused on companies with high return on capital, competitive advantages, and durable growth. Our approach is to stay invested in equities: over time, equities generate the best returns.
Federico Torre
Torre Financial
federico@torrefinancial.com
Disclaimer: This post and the information presented are intended for informational purposes only. The views expressed herein are the author’s alone and do not constitute an offer to sell, or a recommendation to purchase, or a solicitation of an offer to buy, any security, nor a recommendation for any investment product or service. While certain information contained herein has been obtained from sources believed to be reliable, neither the author nor any of his employers or their affiliates have independently verified this information, and its accuracy and completeness cannot be guaranteed. Accordingly, no representation or warranty, express or implied, is made as to, and no reliance should be placed on, the fairness, accuracy, timeliness or completeness of this information. The author and all employers and their affiliated persons assume no liability for this information and no obligation to update the information or analysis contained herein in the future.