


Market, Earnings, and Meta (META) - February 3, 2024
Market commentary, portfolio company earnings results, and a deeper look into Meta (META)

Every two weeks we share a review of the market, any earnings results, and a deep dive into one portfolio company. Subscribe now to follow along.
Market

The market broke out to a new high, surpassing the 494 level. There seems to be very limited resistance on the march upwards. The index continues to form higher highs and higher lows, demonstrating the strong demand for equities.
Investors with excess dry powder or short positions are having their patience tested. Market tops are typically preceded by rapid bursts higher, as the final buyers succumb to the fear of missing out.
The market has moved up fast in the last few months. Although we remain cautiously optimistic, we continue to rotate into better value and are paying attention to any change to the trend.
Year-to-date performance across indices:
Nasdaq +4.9%
S&P 500 +4.0%
Dow Jones +2.6%

Valuation
Having climbed 20% in the last 6 months, is the market expensive?
Looking at the Fastgraph for SPY, it seems the market is pricing in a lot of future growth today. If the market were to trade at the normal PE of 18.8x by December 2026, investors could expect returns in the range of 3-4% per year. This is not particularly compelling when compared to the risk-free yield of ~4% in 10-year treasuries.

Over the last decade, the SPY’s lowest free cash flow (“FCF”) yield was just over 3%. Today, the index is going for 3.24%. Again, not very compelling against ~4% treasury yields. The higher the FCF yield, the better the valuation (for healthy, sound assets).

The VIX volatility index, also known as the fear gauge, has been increasing. Markets tend to be more volatile during declines. Markets tend to climb during calm times.

Performance by sectors can help investors identify underlying trends and opportunities for rotation.
Leading sectors YTD (effectively the month of January) include Communications (+10%), Technology (+5%), Healthcare (+4%), Financials (+4%), Consumer Staples (+3%).
Laggards YTD include Real Estate (-4%), Utilities (-3%), and Materials (-3%). Utilities and Real Estate are typically considered defensive sectors due to their relatively high dividend yields.

Yields
2Y Treasuries currently offer 4.3%, while investors could lock in 4% for the 10 year. The 2-10 yield is inverted and has been inverted since July 2022. The yield curve is said to be inverted when the shorter duration currently pays more than the longer duration treasury.

The rate of inflation is a key driver behind yields. The government reports CPI on a monthly basis and the report typically includes some lagging data. Truflation.com created a realtime index, helpful for a more up-to-date pulse check on inflation.
Truflation.com shows inflation has come down to 1.3%, compared to the government reported rate of 3.4%.

The Fed focuses on balancing stable prices and full employment. A key tool they use to manage both is setting the Fed Funds Rate, effectively defining the yield for short duration assets.
The Feds Fund Rate has been holding between 5.25-5.50%. Market participants had expected a cut in March, but that was wiped out after the last FOMC meeting. The expectation now is for the first cut to come in May 2024, and for the year to end at a 4.00-4.25% range. Lower rates make equities and other assets more attractive investments.
Over the last year the market has been rather optimistic, pulling forward rate cut expectations. The Fed has had to push back and resist. The inflation rate coming down significantly, however, could be a strong reason to act more hastily in cutting rates.
A negative inflation rate, known as deflation, can be very detrimental to an economy. If prices are going down, consumption can decrease significantly as it is always better to wait before making a purchase. It can lead to a deflationary spiral – consumption down, revenue down, profit down, cost cutting, layoffs, people less able to purchase, consumption down more, and repeat.

Earnings
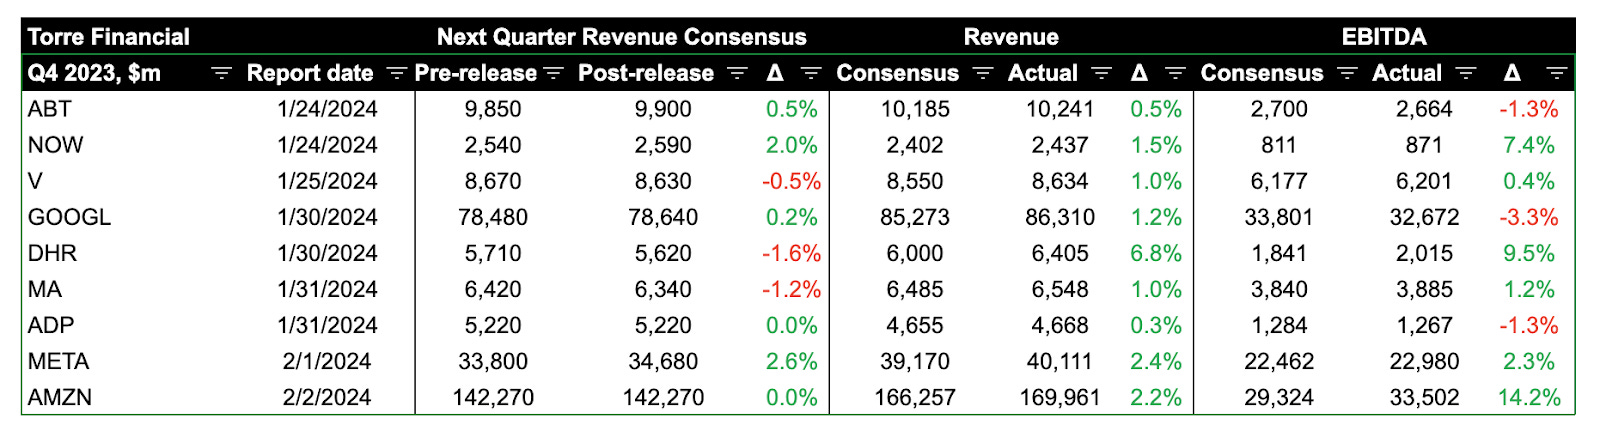
Over the last two weeks, 9 portfolio companies reported earnings.
Meta (META)
Prior coverage:
Market & Earnings Review - February 4, 2023 – META $188
We last covered Meta one year ago. At that time, there was a confluence of factors affecting the company, including:
Apple’s App Tracking Transparency
Increased competition from TikTok and YouTube Shorts
High scrutiny from regulators and a lot of critique from various news outlets
Significant increase in spending on the metaverse and AI
The stock was starting to recover from the low of $88 hit in November 2022.
In that last article, we commented:
“Q4 seems to have been a turning point for the company. The company reported increased engagement across all of their apps, hitting a new high of 2.96 billion daily active people, up nearly 5% y/y. Monthly active people similarly reached a new high of 3.74 billion, up over 4% y/y. Facebook hit a new high of 2 billion daily active users, up 3.6% y/y.”
That aged well, as 2022 Q4 did mark the bottom for Meta’s fundamentals.
Mark Zuckerberg noted that 2023 would be the “Year of Efficiency” and they did just that:
They reduced operating costs, which increases profit
They reduced capex costs, which increases profit
They increased application usage, which increases profit
They increased monetization efficiency, which increases profit
Meta seems to be firing on all cylinders today.
Substantiating the above…
Family of apps monthly active people continues to increase, most recently reaching 3.98 billion people.

Family of apps average revenue per person has reached a high of $10.10.

Even the more “legacy” Facebook brand continues to see an increase in monthly active users as well as monetization.
Ad impressions are up 21% y/y, and the average price per ad is up 2% y/y.
Headcount was 67,317 as of December 31, 2023, a decrease of 22% year-over-year.
Meta has certainly delivered on their efficiency promises.
A lot of this is attributable to Mark Zuckerberg. While he was, and remains firm, on investing in AI and the metaverse, he listened to shareholders and adapted.
That went even further in the most recent earnings release. Demonstrating their commitment to creating shareholder value, Meta is committed to returning cash.
They announced a $50 billion increase in the share repurchase authorization
They announced a quarterly dividend of $0.50 per share, or $2 annualized, for roughly a 0.4-0.5% dividend yield
Diving into the financials:

TTM revenue has accelerated up to 16% y/y, and guidance calls for acceleration up to 21% for the next quarter
Gross margin has held steady at 80-81%. This is top tier.
EBITDA margin has trended up most recently reaching 53%, again a top tier level
FCF margins similarly have improved, up to 33%. Notice the reduction in capital expenditures, which are down from ~9 billion in Q4 2022 to ~6.5-7.5 billion throughout 2023. That is roughly $2 billion in extra free cash flow per quarter!
The balance sheet is strong. Net cash continues to build, now up to $47 billion.
Shares outstanding were significantly reduced throughout 2022 and 2023. This is a great sign of strong management. They were taking advantage of the low share price to buy back stock at attractive levels. Buybacks seemed to have been tempered in the most recent quarter (as the price has shot upwards).
Efficiency metrics look very strong, with EBITDA ROC in of 38% and FCF ROC of 23%. These continue to trend up, alongside margins.
As we had noted in Market & Earnings Review - February 4, 2023, Q4 2022 did turn out to be the bottom of Meta’s fundamentals.
By the time we posted, the stock price had already climbed over 100% from the bottom of $88 in November 2022. The stock market is rather efficient – and tends to lead the data.
Since then, the stock has only continued to march higher in 2023. Including this week’s 20% post-earnings jump, Meta is now up nearly 440% from the November 2022 low!
Meta shares have increased from a low of $88 to a high of $475.

As for valuation:
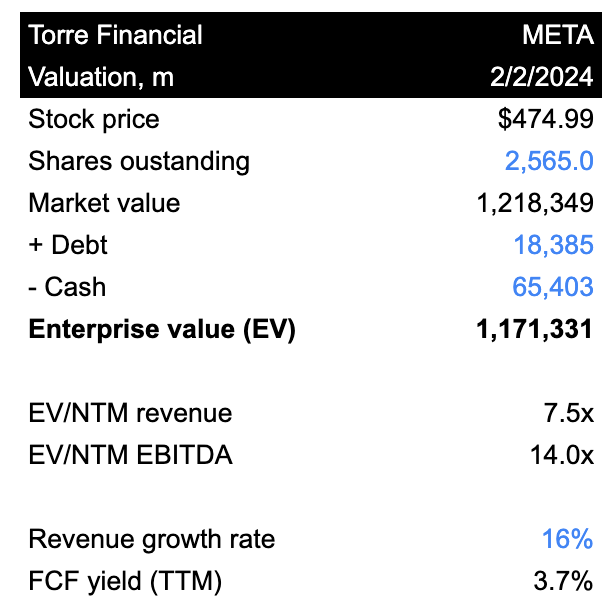
Notwithstanding the rapid appreciation, Meta continues to trade at a reasonable valuation. An EV/NTM EBITDA multiple of 14x is normal across any healthy company, and could be considered cheap for a high quality & resilient company. With growth accelerating above 20%, a TTM FCF yield of 3.7% seems pretty reasonable.
The following table shows possible annualized returns over the next 5 years across various scenarios. The model assumes no annual share reduction.

Analysts expect EBITDA to grow 12-17% annually through FY 2026.
With a current multiple of 14x, there is still room for further expansion.
Even at this seemingly-elevated level of $475, META shares could generate returns of 11-18% per year.
Fastgraphs provides another perspective on valuation.
Looking at operating cash flow (OCF instead of FCF, because META is willingly choosing to invest into capex), META shares have historically traded at a multiple of 22.5x. They are trading at 17.3x OCF today.
If shares were to re-rate to their historical multiple over the next few years (22.5x by 12/26, considering estimated growth), META shares could generate returns greater than 20% per year.

Closing thoughts
Investing in the market is about much more than solely financial analysis. Astute investors consider:
The encompassing macroeconomic environment
The narrative and financials at the business level
The underlying drivers behind changes to both the macro and microeconomics
The nature of human psychology, particularly crowds
Their own behavioral biases
We often reflect on prior experiences to learn and tweak how we work. One of our biggest lessons, early on, was selling a position that finally reached “breakeven.” After suffering through the dramatic fall, we were happy to sell once the price came back to our purchase point. Little did we know, that stock went on to go much higher.

Meta provided us a chance to apply our learnings. Although tested (significantly tested! with a nearly 80% drawdown!), we were able to hold through the challenging time. When we saw the fundamentals turn, we started adding to our position. Watching the fundamentals climb in lockstep with the price gives us the conviction to continue to hold patiently.
We are always looking for the best companies to invest in for the long term. We always look for high return on capital, competitive advantages, and durable growth. At times, the market may be skeptical on one or more of these, resulting in cheaper prices. We embrace those opportunities.
--
Torre Financial is an independent investment advisory firm focused on emerging and established compounders – companies with high return on capital, competitive advantages, and durable growth.
Federico Torre
Torre Financial
federico@torrefinancial.com
Disclaimer: This post and the information presented are intended for informational purposes only. The views expressed herein are the author’s alone and do not constitute an offer to sell, or a recommendation to purchase, or a solicitation of an offer to buy, any security, nor a recommendation for any investment product or service. While certain information contained herein has been obtained from sources believed to be reliable, neither the author nor any of his employers or their affiliates have independently verified this information, and its accuracy and completeness cannot be guaranteed. Accordingly, no representation or warranty, express or implied, is made as to, and no reliance should be placed on, the fairness, accuracy, timeliness or completeness of this information. The author and all employers and their affiliated persons assume no liability for this information and no obligation to update the information or analysis contained herein in the future.