


Market, Earnings, & Moody’s (MCO) - March 29, 2025
Market commentary, portfolio company earnings results, and a deeper look into Moody’s (MCO)

Every two weeks we share a review of the market, any earnings results, and a deep dive into one portfolio company. Subscribe now to follow along.
Market
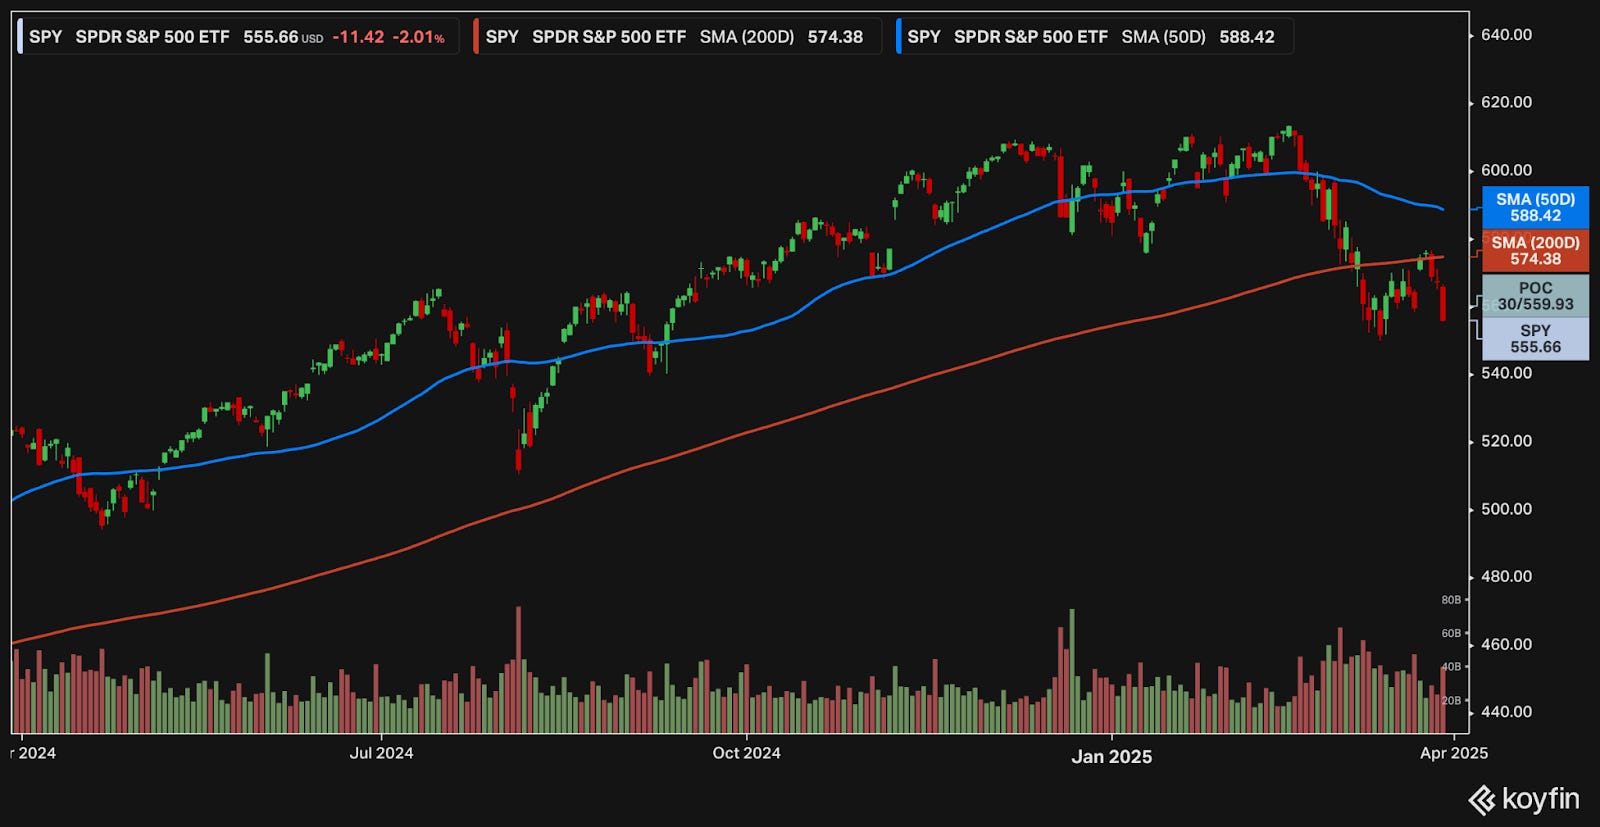
Momentum has decidedly turned south, as the index continues the drawdown that began in mid February.
The index bounced back as the market hit the 10% drawdown. The short-lived rebound overcame the 200-day moving average for a brief moment, before selling off quite abruptly and forming a higher low.
The 50-day moving average is on a downtrend. The index is below both the 50-day and 200-day moving averages. From a technical perspective, not great. A “death cross” occurs when the 50-day moving average crosses below the 200-day trendline. If triggered, this death cross pattern would fuel further concerns.
It is best to remain cautious.
Year-to-date performance across indices:
S&P 500 -5.11%
Nasdaq -8.24%
Dow Jones -2.26%

The actions of the Trump Administration continue to foster uncertainty and ambiguity.
Major tariffs, including 25% on all imported vehicles and reciprocal tariffs, are scheduled to go into effect on April 2nd.
USAID has been completely dissolved.
Trump is negotiating peace talks with Putin, in efforts to end the war in Ukraine. Yet, in doing so, is countering many of the sanctions the European Union has set in place.
These, amongst other, initiatives have very effects on international relationships and American companies. Many important trade partners and allies are not happy, and are starting to take action.
Germany has moved quickly on a large spending package for as much as €1 trillion for defense, to reduce military reliance on the US.
Mark Carney, Canada’s Prime Minister delivered a speech, claiming “The old relationship we had with the United States based on deepening integration of our economies and tight security and military cooperation is over”
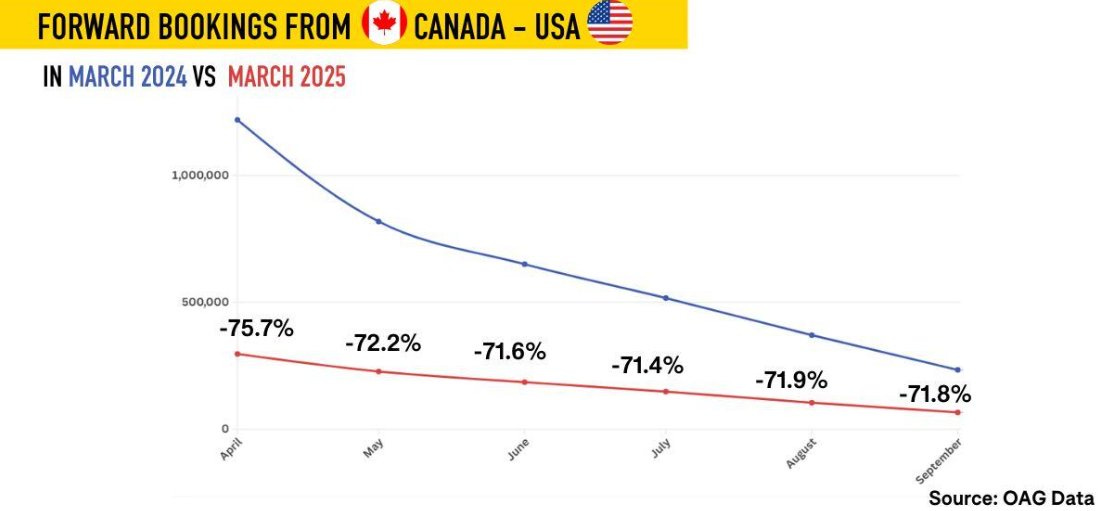
It isn’t just governments either. People are bothered by the rhetoric and proposals. It has implications on American businesses, as many have significant international revenue, and the economy. A clear example: flights from Canada to the USA are down significantly, demonstrating a clear aversion.
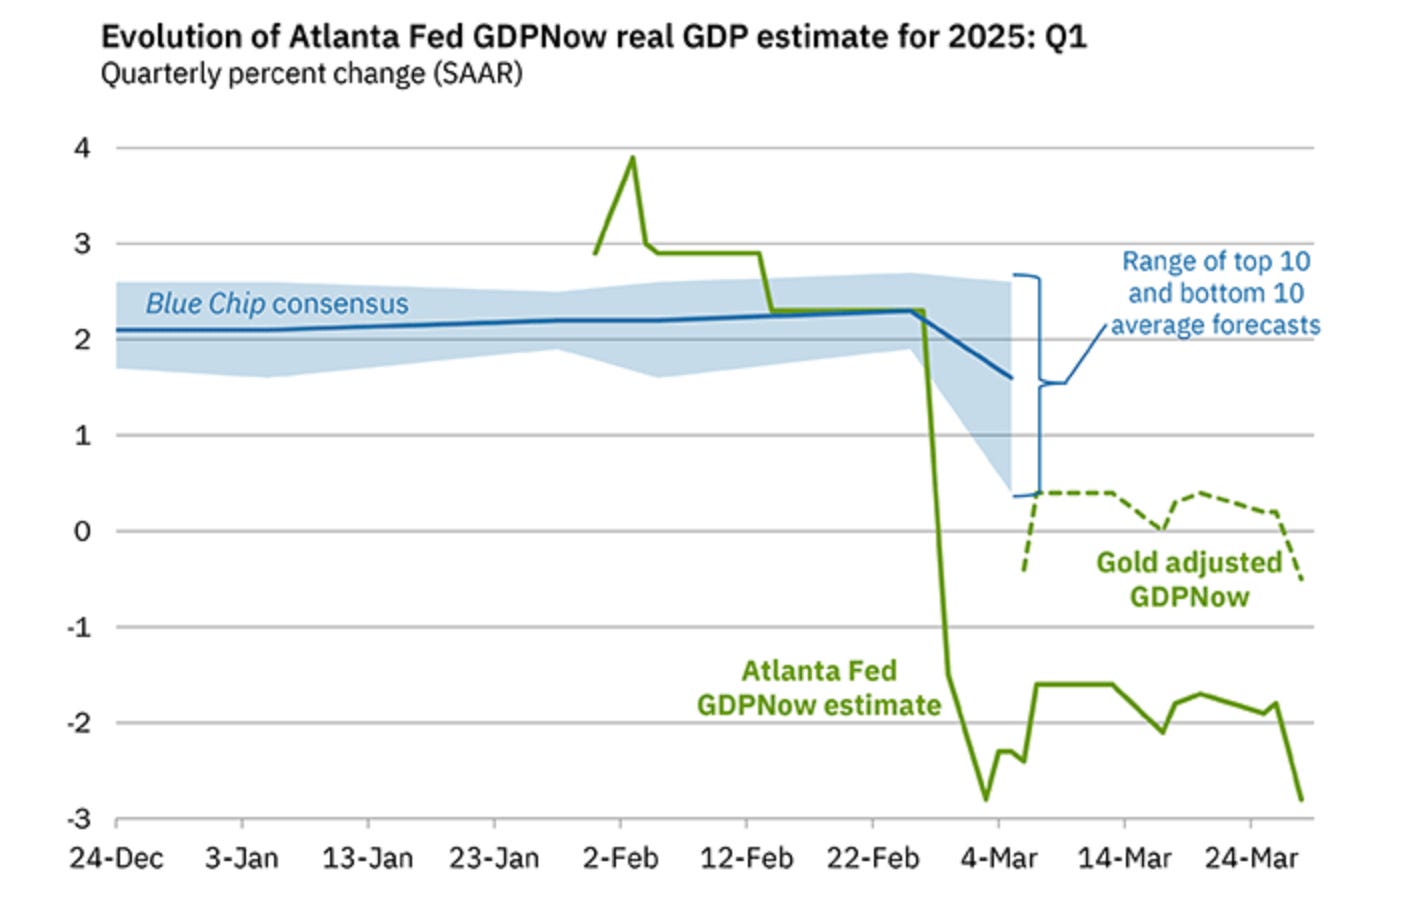
Atlanta Fed’s GDPNow Indicator shows a drastic decline for Q1 2025 GDP, with the forecast dropping from 2% to nearly -3% in just 30 days. While not the official GDP number, this indicator provides a running estimate of GDP growth based.
Equity markets got the message. The S&P 500 and Nasdaq indices are adjusting as investors pullback amidst the uncertainty in policy, growth, and earnings. Valuation inherently depends on forward earnings, making these moments potentially more heavily influenced by sentiment and/or technicals.
The Nasdaq index is typically more volatile & expressive. It has been leading on the way up, and now leading on the way down. It is a good indicator to watch to better understand when sentiment is turning.
For now, the Nasdaq (QQQ) seems to be in a precarious position, currently challenging its recent low. If the index were to break below $465, the volume shelves look like they have an air pocket until the $445 level where the index could find some support. This would represent another 5% decline.

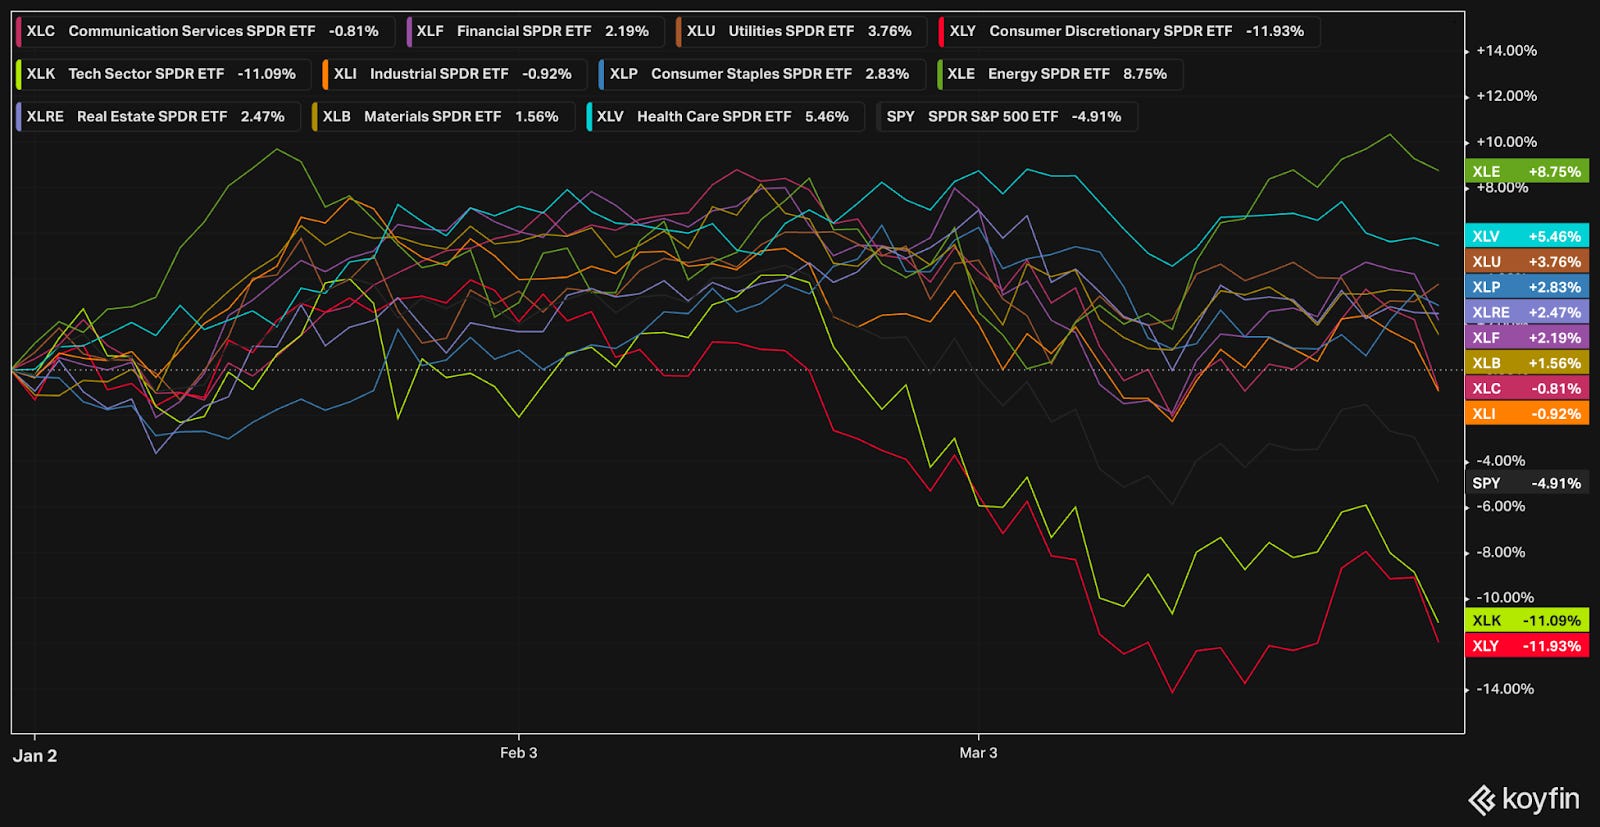
Not all sectors are feeling the pain. In fact, most sectors are up YTD.
Energy, Health Care, Utilities, and Consumer Staples have been the top performers. Energy likely benefits from the pro-oil administration. Health Care, Utilities, and Consumer Staples are typically seen as defensive sectors.
Technology and Consumer Discretionary are the laggards. These are typically seen as more aggressive, or “risk on” sectors.
Relatedly, value investing seems to be gaining momentum over growth investing. The divergence became more pronounced as the sell off accelerated in late February.

In the bond market, credit spreads have started to widen although still at a typical historical level.

Credit spreads are an important indicator to watch, as they can give insight into the financial flexibility of the economy. Widening credit spreads can occur when lower-grade fixed income investments are sold off, i.e. investors sell risky assets and flock towards safety. As those assets sell off, the yield increases. Lenders then require that higher rate of return on any new loans, which can dampen demand & result in a slowdown to the debt markets and therefore economic growth.
With so many moving parts, it can be difficult to grasp the direction of the economy. Will the government layoffs increase unemployment numbers and significantly dampen demand? Tariffs will bring higher prices – which force will be the strongest between higher inflation or lower consumption? How will the combination of all of these factors affect the economy? Will we need to stimulate or dampen?
Market participants expect the Fed will cut rates 3 times in 2025, bringing the Federal Funds rate to 3.50-3.75% by December.

Earnings
Over the last two weeks, 1 portfolio company reported earnings.

Moody’s (MCO)

John Moody established John Moody & Company in 1900 and started publishing financial statistics in his market assessment "Moody's Manual of Industrial and Miscellaneous Securities." Eventually, he had to sell his company due to a shortage of capital.
In 1909, he founded Moody's Analyses Publishing Company, focusing specifically on railroad bonds with "Analysis of Railroad Investments." This marked the beginning of modern bond credit ratings.
Over time, Moody's expanded its scope to include ratings for various entities, including industrial firms, utilities, and government bonds.
In 1962, Moody's was acquired by Dun & Bradstreet. By the late 1990s, shareholders were pressuring Dun & Bradstreet to separate the businesses due to Moody’s superior performance.
The Moody’s publishing business was sold off to Financial Communications in 1999.
In 2000, Moody's rating business was spun off as an independent, publicly traded company listed on the NYSE under MCO.
John Moody is credited with pioneering the concept of widely accessible bond credit ratings, providing investors with valuable insights into the risk associated with different securities.
Today, Moody’s is a financial services company underpinning much of the modern day financial system.
The company covers many critical services including ratings, research & insights, data & information, and decision solutions.

Moody’s is organized into two large segments: Moody’s Investors Service (MIS) and Moody’s Analytics (MA).
For more than 115 years, Moody’s Investors Service (MIS) has been a leading provider of credit ratings, research, and risk analysis helping businesses, governments, and other entities around the globe.
In 2024, MIS generated $3.8 billion in revenue, accounting for 53% of Moody’s total revenue.
The MIS business focuses on various groups, including:
CFG - Corporate Finance
SFG - Structured Finance
FIG - Financial Institutions
PPIF - Public project and infrastructure finance
These companies effectively need a credit rating before they can go out and borrow money (i.e. raise capital through issuing bonds).

Moody’s main output is the publication of the ratings. All ratings are publicly available.

Moody’s charges the issuer a fee for their rating service, which consider various factors including:
The type of rating being assigned
The complexity of the analysis involved
The principal amount of the debt issuance
These ratings are critical for companies because they determine their cost of capital for borrowing. For this reason, issuers are willing to pay for the rating service and make the rating available for investors to use.
While the price changes constantly, this study from 2021 is illustrative of the variance:
The highest rated bonds (Aaa) had an average yield of 2.26% – very low cost of capital for those firms
The lowest investment grade bonds (Baa) had a higher avg yield at 3.16%
Moving to non-investment grade (Ba) had a significant jump up to 6.54%
These yields are a good proxy for the interest rates companies in each rating have to pay. The difference between them shows how valuable a better rating could be!

Moody’s Analytics (MA) provides software, data, intelligence and analytical tools to help business and financial leaders make confident decisions and manage risk.
Moody’s Analytics generated $3.3 billion in revenue for 2024, or 47% of the total. This business model is primarily subscription as a service (SaaS).
MA focuses on three distinct areas:
Decision solutions – i.e. banking, insurance, KYC
Research & insights
Data & information

Moody’s has a very strong business, as evidenced by their strong numbers for 2024:
$7.1 billion in revenue
20% revenue growth
48% adj. Operating margins
34% free cash flow growth

Looking further back, it is clear that Moody’s has a solid and proven track record of durable growth. Over the last 20 years,
Revenue has grown from $1.44 billion in 2004 to $7.1 billion in 2024
Free cash flow has grown from $553 million in 2004 to $2.52 billion in 2024

Both revenue and FCF had a CAGR of ~8.8%, or over 5x during these 20 years.
And shareholders would be happy as share performance has greatly eclipsed the fundamentals, with nearly 15x, or ~14% CAGR!

Moody’s has been able to grow and maintain their competitive advantage over time. Two key aspects have helped them here:
The market dynamics for credit ratings, wherein there are a small number of players (i.e. Moody’s, S&P Global, and Fitch)
The industry they serve – debt issuance – is effectively indexed to inflation. Over time, the capital needs of companies grow as prices increase.
Moody’s has been running an efficient use of their own capital. While return on invested capital has come down over time, it is still a very respectable nearly 20% ROIC. Compression has happened over time due to acquisitions, such as the $3 billion acquisition of Bureau van Dijk in 2017 and continued capital investments to build out the new SaaS businesses and offerings (KYC, climate, etc).

Diving into the quarterly financials:

Very impressively all major operating metrics are moving in the right direction.
TTM revenue growth was 20%, having climbed up consistently over the last year
TTM gross margin was maintained at 73% in the last few quarters, after bumping up from 70%
TTM EBITDA margin came in at 48%, following sustaining improvement from a recent low of 41%
TTM FCF margin is 36%, also trending steadily higher. This is a very strong free cash flow margin, emphasizing the moat around their business
The balance sheet is healthy, with $2.9 billion in cash and $7.6 billion in debt. Net debt is less than 2x FCF, which is very healthy.
Shares outstanding decreased 1.4%, showing the efficacy of share buybacks
ROIC and FCF ROIC came in at 23.7% and 21.2% respectively, showing the company’s return on capital inclusive of capital expenditures for M&A
ROIC ex goodwill came in at 47.9%, showing the low ongoing capital requirements of the company. In theory, as long as they pause the acquisitions, ROIC should rise steadily over time.
As for valuation:

MCO shares trade for a 23x NTM EBITDA multiple, or just over a 4.3% NTM EBITDA yield. This doesn’t seem particularly expensive for such a high quality, established company. The current multiple is higher than the 10-year historical mean of 19.7x.
From a FCF perspective, MCO shares yield 2.9%. Not extremely expensive, but also not necessarily a bargain. The current yield is slightly more expensive than the 10-year mean of 3.3%.

Looking at the next few years, revenue is expected to grow ~7-8% and EBITDA is expected to grow ~8-10%.

The following table shows possible annualized returns over the next 5 years across various scenarios. The model assumes share count declines by 1% per year. Returns include dividends.

Over the next 5 years…
If EBITDA grows at 8% CAGR and the multiple contracts to 20x, shares could return 6% per year
If EBITDA grows at 9% CAGR and the multiple is mostly maintained at 24x, shares could return 11% per year
Fast Graphs provides another look:

If the P/E multiple (35.8x) were to compress to the historical average (30.6x) over the next few years, shares could generate an annualized return of 7% over the next few years.
–
Torre Financial is an independent investment advisory firm focused on companies with high return on capital, competitive advantages, and durable growth. Our approach is to stay invested in equities: over time, equities generate the best returns.
Federico Torre
Torre Financial
federico@torrefinancial.com
Disclaimer: This post and the information presented are intended for informational purposes only. The views expressed herein are the author’s alone and do not constitute an offer to sell, or a recommendation to purchase, or a solicitation of an offer to buy, any security, nor a recommendation for any investment product or service. While certain information contained herein has been obtained from sources believed to be reliable, neither the author nor any of his employers or their affiliates have independently verified this information, and its accuracy and completeness cannot be guaranteed. Accordingly, no representation or warranty, express or implied, is made as to, and no reliance should be placed on, the fairness, accuracy, timeliness or completeness of this information. The author and all employers and their affiliated persons assume no liability for this information and no obligation to update the information or analysis contained herein in the future.