


Market, Earnings, & MSCI (MSCI) - April 26, 2025
Market commentary, portfolio company earnings results, and a deeper look into MSCI (MSCI)

Every two weeks we share a review of the market, any earnings results, and a deep dive into one portfolio company. Subscribe now to follow along.
Market
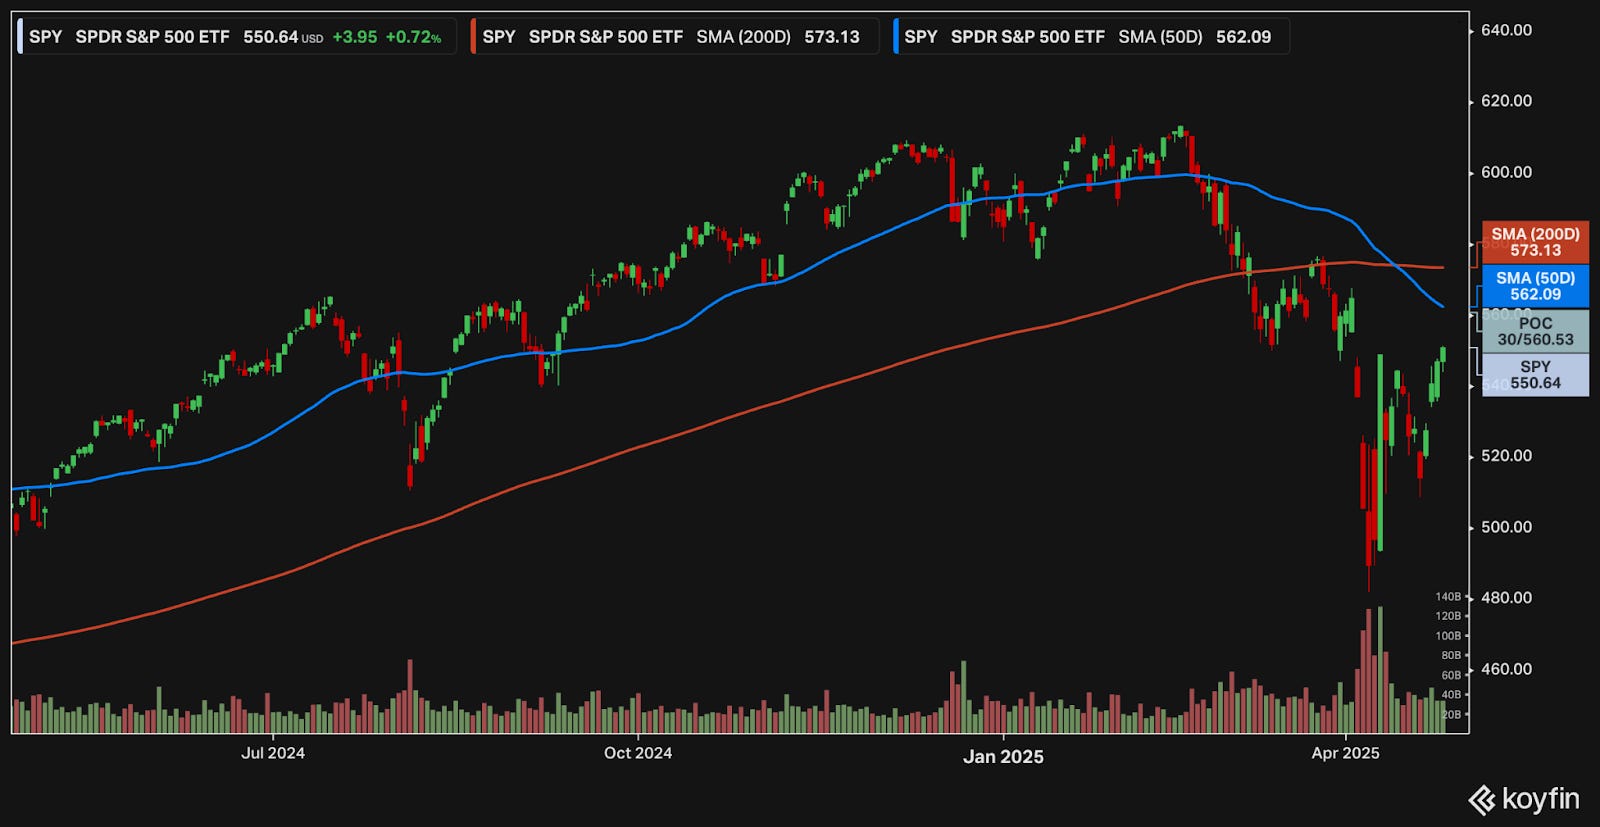
The market bounced back this week, as the administration’s tone softened on recent rhetoric. The S&P 500 was able to overcome the April 9th local peak, locking in a higher low and a higher high.
While the recent movement is positive, there is still quite a ways to go for the “all clear”. The death cross is ominous. The market will need to reclaim at least the 50-day moving average to start shifting the technical picture.
If the market trades up, the 575 level will be important to watch. The local peak will likely face resistance; overcoming it would be a strong sign.
For now, it may be best to tread lightly and stay cautious.
Year-to-date performance across indices:
S&P 500 -6.06%
Nasdaq -7.52%
Dow Jones -5.71%

On April 2nd, Trump announced a slate of tariffs, instantly shifting the global trade paradigm. Liberation Day, as he called it, sought to address trade imbalances and ended up creating significant turmoil and uncertainty.
The volatility index, or VIX, spiked above 60. The two most recent comparable events are:
August 2024 when the VIX spiked to 65 on worries about the Yen carry trade unwinding, and
March 2020 when the VIX spiked to 85 as the COVID pandemic spread and the whole economy shut down

It has paid well to buy when others are fearful. In the past, whenever the VIX was above 50, returns have been very strong:
Avg 1 year forward returns: 35%
Avg 3 year forward returns: 55%
Avg 5 year forward returns: 129%
Forward returns have been positive in every single instance.

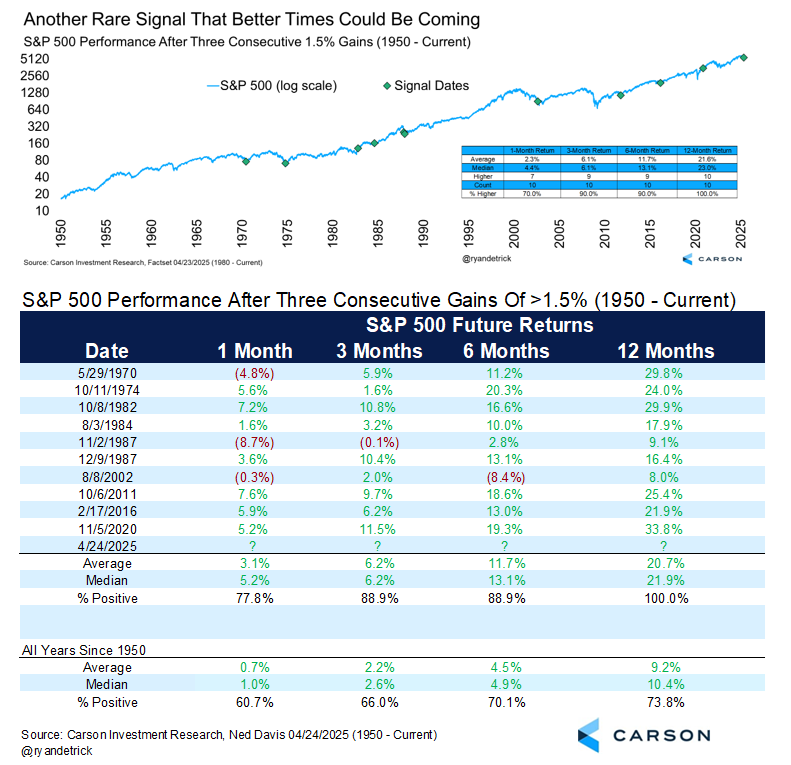
The positive movement came quickly, as the market was up at least 1.5% for three days in a row throughout April 20-25.
This strong performance has historically been a good sign. Looking at past occurrences, the market has rallied 21% over the following 12 months.
The market has been particularly choppy, and it will likely continue for some time.
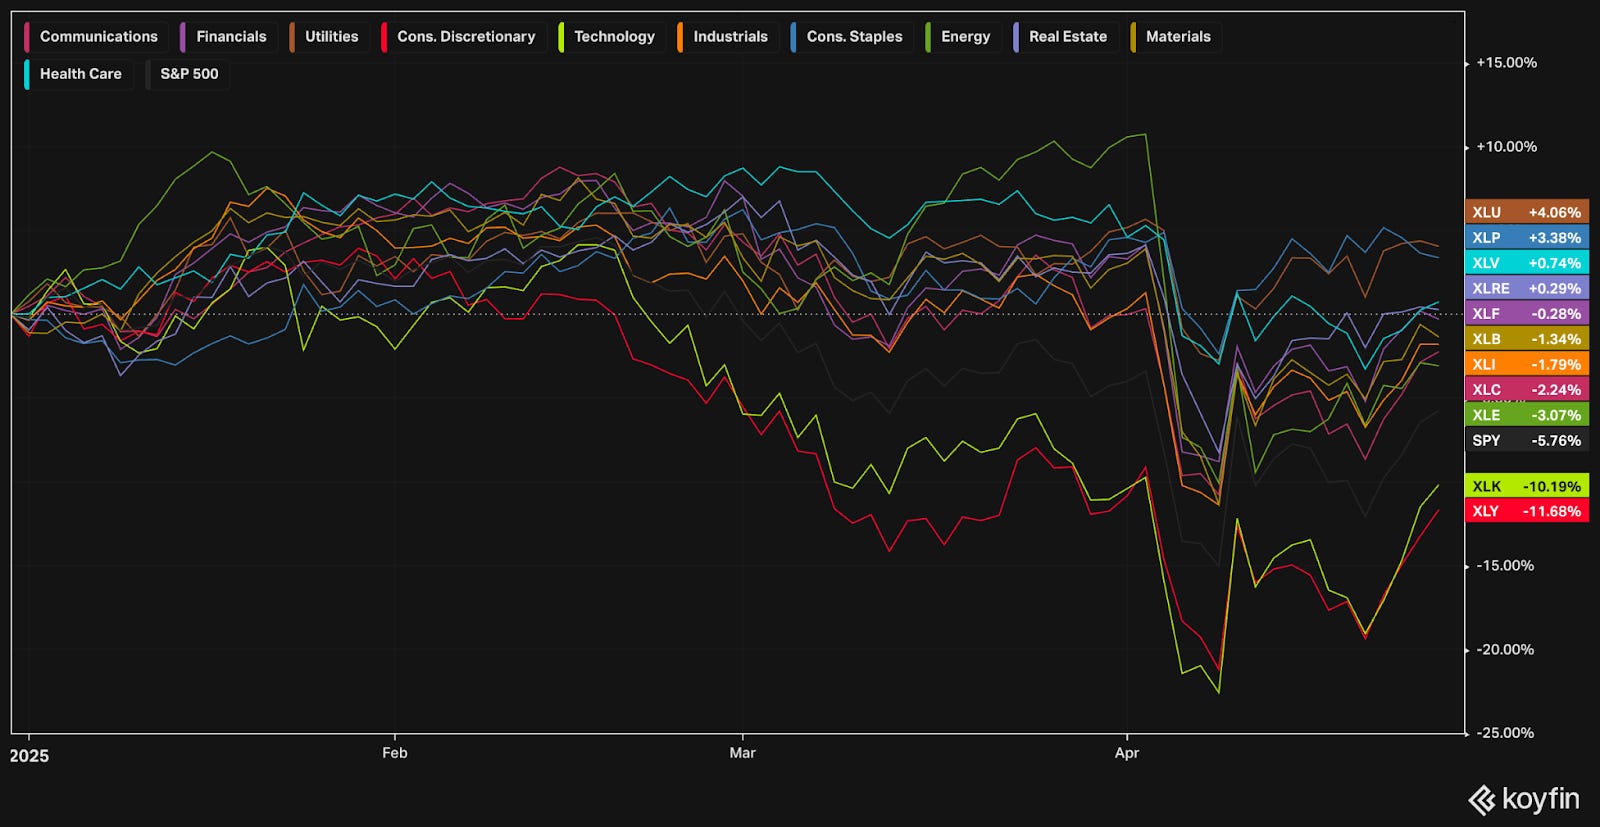
Recent winners have been in defensive corners of the market.
The best performing sectors YTD are Utilities, Consumer Staples, and Health Care – risk off sectors.
The worst performing sectors YTD include Consumer Discretionary and Technology – risk on sectors.
Specific winners include defensive names like Phillip Morris (+43%), Berkshire Hathaway (+17%), Costco (+7%) and Walmart (+6%).
Gold is also up significantly, +26% for the year.

Treasuries have historically been a safe haven. When equities go down, money would flow into treasuries. This pattern seems to have shifted recently, as equities and treasury prices moved much closer in tandem since Liberation Day.

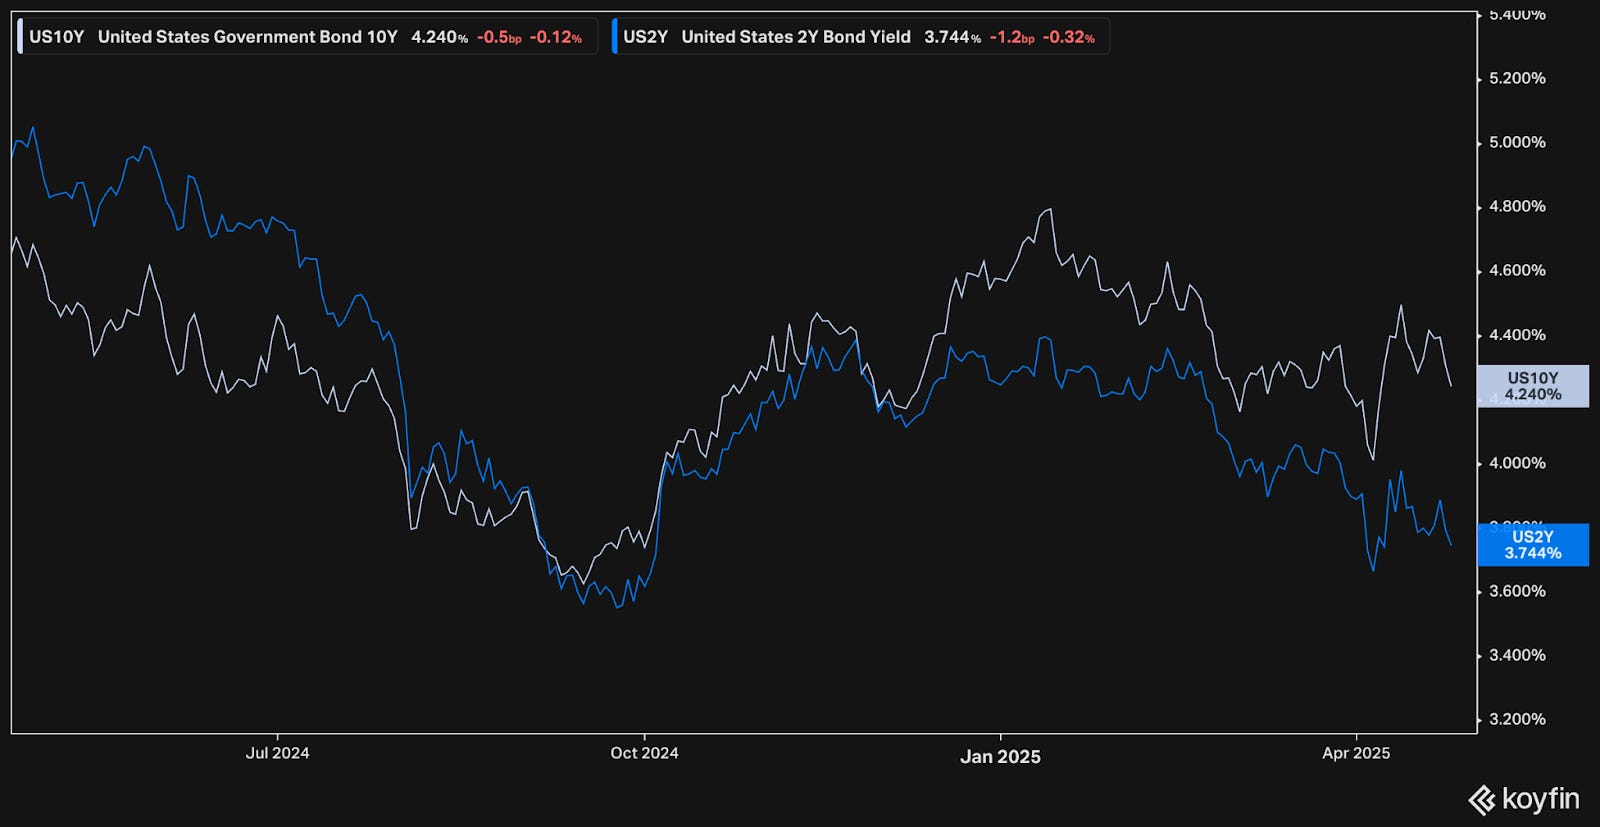
That said, yields have been trending downwards throughout 2025. The yield curve un-inverted around October 2024 and the spread between the US 10 year yield and the 2 year yield has widened since.
The credit markets similarly experienced a jolt following Liberation Day. A spike in the credit spreads caused concern, as an increase in yields could slowdown access to capital & lack of liquidity could have a significant impact on the economy. That seems to be abated, with credit spreads coming back down.

With yields popping higher right after Liberation Day and the stark movement in credit markets, there were concerns that governments and large institutions were selling US treasuries, and there might be a dearth of buyers for upcoming auctions.
Fund flows are now showing a different picture. Flows into treasuries have been robust, hitting new high markers these last few weeks.

Earnings
Over the last four weeks, 10 portfolio companies reported earnings.

MSCI (MSCI)

In 1968, Capital International began publishing indices covering global, non-US stock markets.
Later that year, Morgan Stanley licensed the rights to their indices and branded them as “Morgan Stanley Capital International,” or MSCI.
By the 1980s, those indices became the standard benchmarks for international markets.
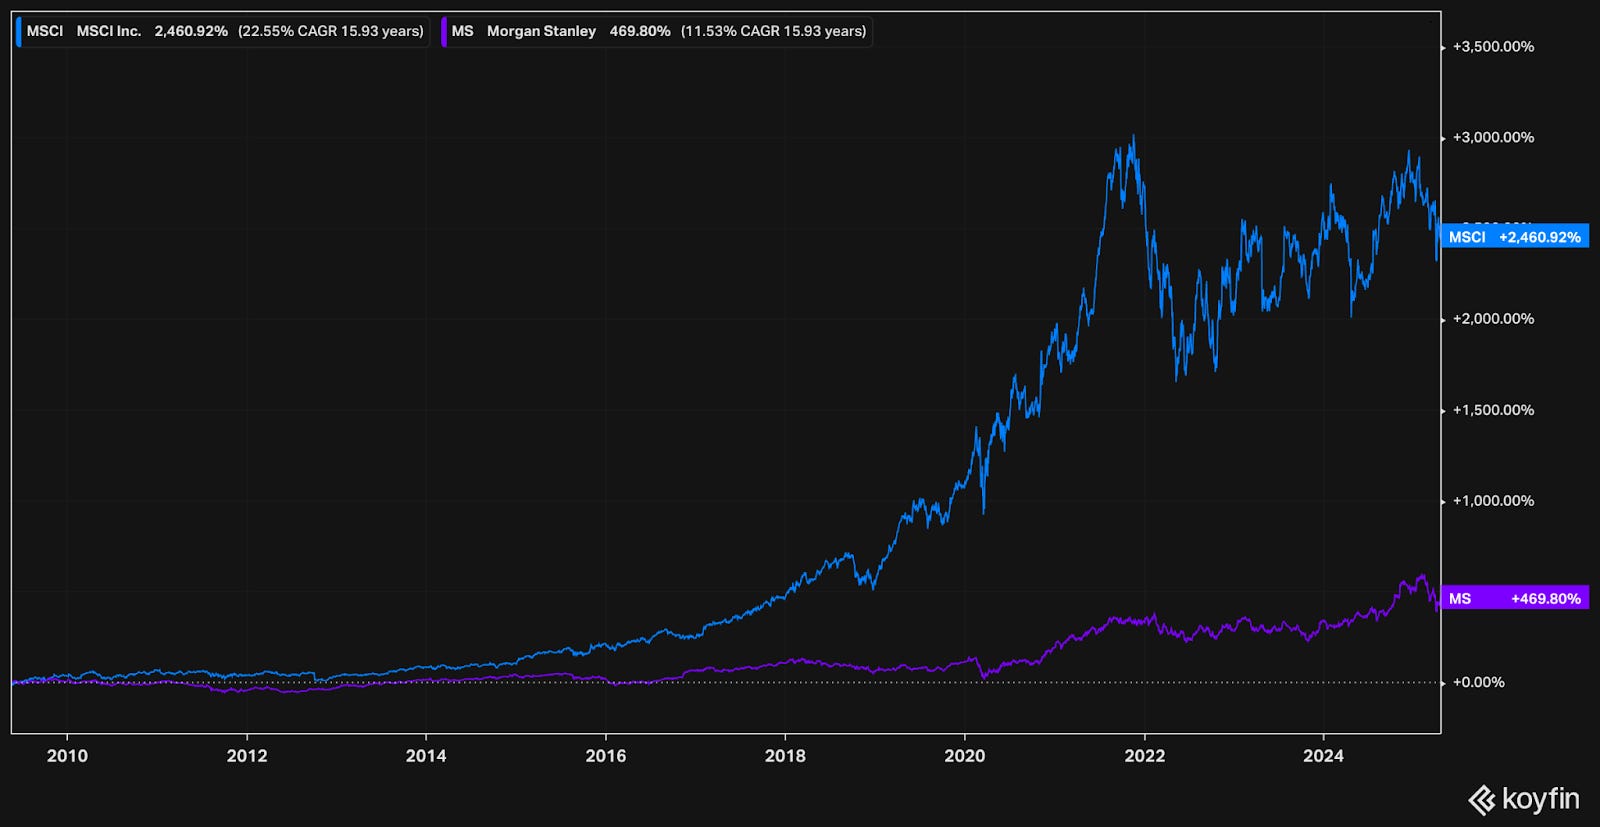
In November 2007, Morgan Stanley began divesting MSCI through a spin-off, selling a minority interest in the public markets. This debuted as MSCI’s IPO.
In the midst of the Great Financial Crisis, Morgan Stanley sold its remaining stake in MSCI as regulators required they boost capital. On that day, May 18, 2009, MSCI fell 10% to $21.
Since then, MSCI has compounded at 22.6% over the next 16 years. Over the same period, MS has grown at about half the rate – 11.5% CAGR.
A $100,000 investment in MSCI would have become $2,605,238.
A $100,000 investment in MS would have become $570,686.
Consistent since its early days, MSCI is a leading provider of investment decision support tools such as indices and risk management tools for investment institutions worldwide.

They serve large investors across the board, including asset owners, asset managers, investment managers, corporations, and more. They are deeply embedded in the industry, connecting data, technology and models across key players.

MSCI breaks their business out into 4 product lines:
Index business – subscriptions to index feeds & custom index creation by fee
Analytics – risk management, performance attribution, and related tools
Sustainability & climate – subscription to ESG data
Private assets – collection of data, tools, and services for private asset players, such as fund administration, investment management, and standardized proprietary data sets

The index business includes well known indices such as the MSCI World Index.

MSCI has been very well managed since inception. Over the last 10 years, net income has increased 6x. At the same time, shares outstanding have come down 31%. The return on invested capital has trended higher, currently at 35%.

Their asset light and high margin business model gives them a lot of optionality on how and where to invest.
An example of management’s high bar is the criteria they set for investments. Their “triple crown” focuses on: high return for projects invested (ROI), quick payback period of <3 years, and preferring investments with greater impact on valuation.
MSCI has positioned themselves as the leader for global data and benchmarks. International markets have significant room to grow. Additionally, the recent administration’s moves have fueled investment in foreign markets. MSCI’s index business grows inline with index AUM.
CEO, Henry Fernandez who has been at the helm since 1998, had an interview with Barron where he gave light on further opportunity ahead:
“When I took over MSCI, the SPDR ETF was already in place and MSCI was working on the first ETF for international markets. We could blanket the world with futures and options for equity indices. Later, I realised what we did in equity, we could do in fixed income, in global private asset classes, in real estate. We were international. A lot of the other providers were mostly domestic, catering to domestic investing”
They are acting on that vision. Recent acquisitions include RCA and Burgiss, two large players in private equity markets, boosting their private asset management datasets.
With these acquisitions, MSCI is extending from solely processing data, to also gathering and producing data. By continuing down this path, they could build up a proprietary database for private asset classes.
And they are already putting these plans to work. On April 21, 2025, they announced a partnership with Moody’s to launch risk assessments for private credit investments. MSCI provides the data; Moody’s provides the model.

Private credit has been particularly trendy recently. Large institutions are now starting to offer more and more private credit options for retail investors.
All said, there is plenty of room for MSCI to continue growing for many years to come.
Diving into the quarterly financials:
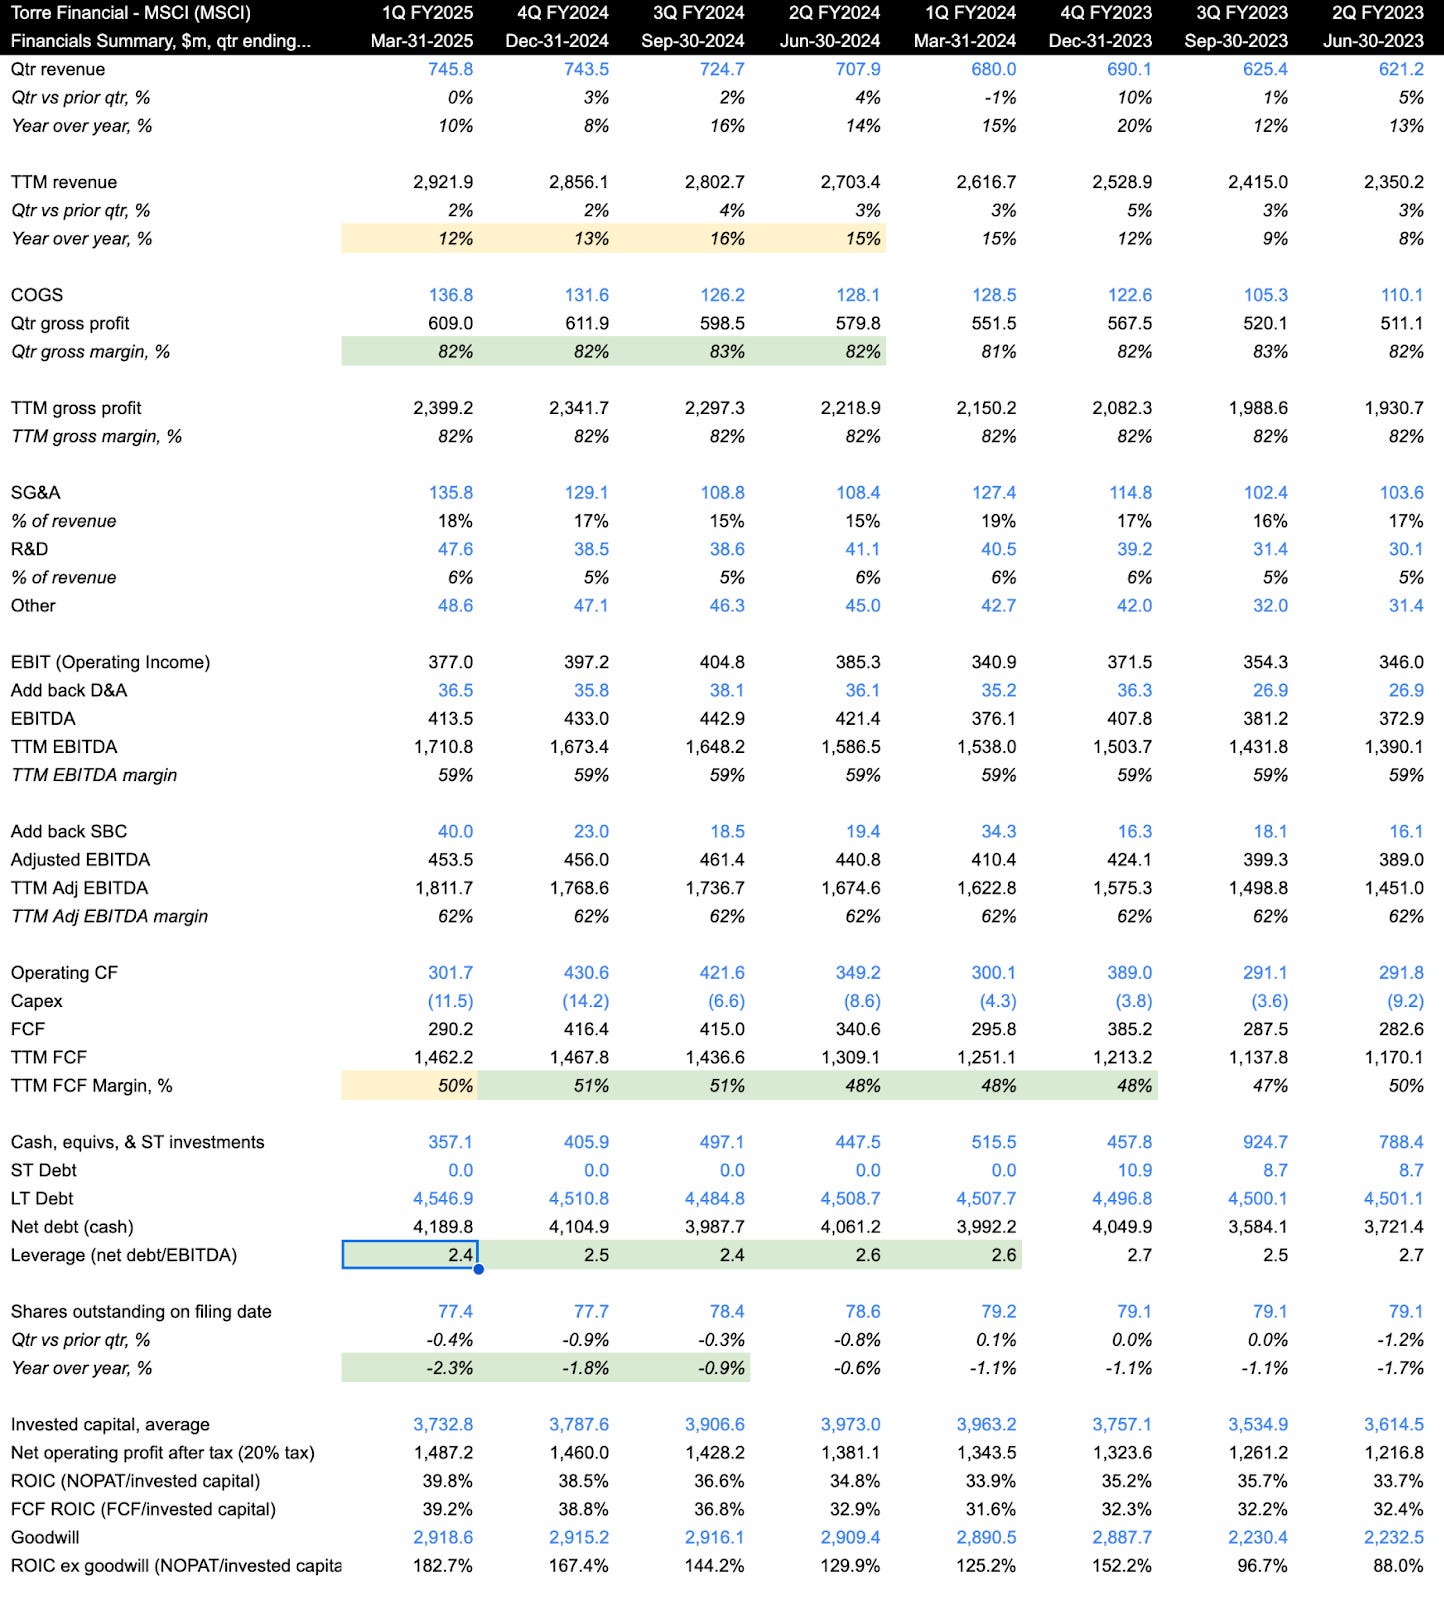
Very impressively all major operating metrics are moving in the right direction.
TTM revenue growth came in at 12%, declining slightly over the last few quarters, but inline with historical numbers
TTM gross margin of 82% has been incredibly steady over the last few years; this is a very strong number
TTM EBITDA margin of 59% has also been incredibly steady; also a very strong margin
TTM FCF margin ticked lower to 50%, yet has been increasing over the years; 50% FCF margin is very impressive
The balance sheet is healthy. They do have net debt of $4.1 billion. Compared to EBITDA of 1.7 billion, it would take 2.4 years worth. That leverage multiple has come down over time, primarily due to EBITDA increasing and debt staying steady. We tend to prefer companies with lower debt, or ideally positive cash. Notwithstanding, MSCI is very healthy and has been allocating that capital.
Shares outstanding declined 2.3% y/y. Share buybacks are one use of that extra capital.
Efficiency ratios are very strong, with a ROIC of 39.8% and FCF ROIC of 39.2%. When backing out goodwill, ROIC jumps to 182% – demonstrating opportunity for the ROIC to continue trending up.
As for valuation:

MSCI shares are trading for 24x EV/NTM EBITDA, a very fair valuation for such a high quality company. The current multiple is below the 10-year historical average of 24.9x.
From a FCF perspective, MSCI shares yield 3.2%, currently cheaper than the historical average of 2.8%.

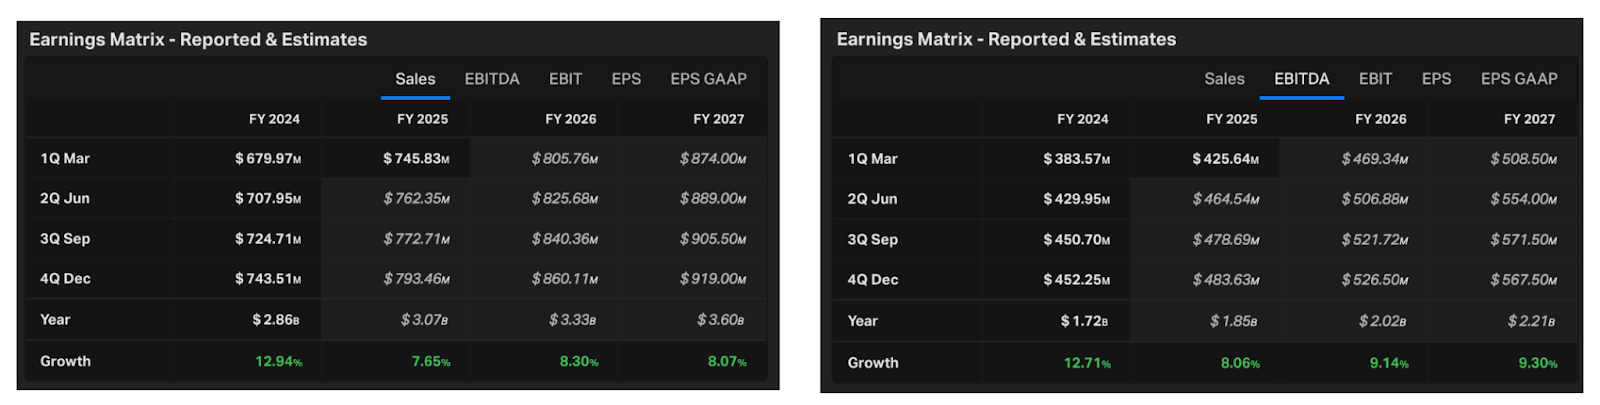
Looking at the next few years, revenue is expected to grow ~7-8% and EBITDA is expected to grow ~8-9%.
The following table shows possible annualized returns over the next 5 years across various scenarios. The model assumes share count declines by 0.5% per year. Returns include dividends.

Over the next 5 years…
If EBITDA grows at 8% CAGR and the multiple stays at 24x, shares could return 10.6% per year
If EBITDA grows at 9% CAGR and the multiple expands slightly to 26x, shares could return 13.5% per year
Fastgraphs provides another look:

If the current P/E multiple (34.0x) were to expand to the historical average (34.5x) over the next few years, shares could generate an annualized return of 14.3% over the next few years.
–
Torre Financial is an independent investment advisory firm focused on companies with high return on capital, competitive advantages, and durable growth. Our approach is to stay invested in equities: over time, equities generate the best returns.
Federico Torre
Torre Financial
federico@torrefinancial.com
Disclaimer: This post and the information presented are intended for informational purposes only. The views expressed herein are the author’s alone and do not constitute an offer to sell, or a recommendation to purchase, or a solicitation of an offer to buy, any security, nor a recommendation for any investment product or service. While certain information contained herein has been obtained from sources believed to be reliable, neither the author nor any of his employers or their affiliates have independently verified this information, and its accuracy and completeness cannot be guaranteed. Accordingly, no representation or warranty, express or implied, is made as to, and no reliance should be placed on, the fairness, accuracy, timeliness or completeness of this information. The author and all employers and their affiliated persons assume no liability for this information and no obligation to update the information or analysis contained herein in the future.