


Market, Earnings, & PepsiCo (PEP) - January 18, 2025
Market commentary, portfolio company earnings results, and a deeper look into PepsiCo (PEP)

Every two weeks we share a review of the market, any earnings results, and a deep dive into one portfolio company. Subscribe now to follow along.
Market

The new year has kicked off with increased volatility. The S&P 500 has gone for over a month without making a new high.
The index has dipped below the 50-day moving average three times, forming lower lows each time.
The “lower lows, lower highs” pattern was broken on Friday 17th, by just a hair. This week SPY closed at 597.58, just a hair above the most recent high of 597.42 on January 7th and also above the 50-day simple moving average.
Investors have been cautious, yet there’s a chance for the market to get its momentum back. Next week’s price action will be critical from a technical perspective.
Year-to-date performance across indices:
S&P 500 +1.96%
Nasdaq +2.04%
Dow Jones +2.22%

The market has had strong reactions to recent economic reports.
On January 10th, the December jobs report came in strong. Payroll grew by 256,000 – much higher than the 212,000 in November and above the forecast of 155,000. The unemployment rate fell to 4.1%.
Stock markets sold off on the news. A stronger job market makes it less likely the Fed would cut rates, as it increases demand and willingness to pay, ultimately pushing inflation higher.
On January 15th, the CPI inflation report came in better than expected. The headline inflation rate came in at 2.9%, inline with forecasts. The core inflation rate slowed to 3.2% in December, less than expected.
Stock markets jumped on the news. With inflation coming down, the Fed has more room to cut rates. Lower inflation (steady at 2-3%) is the ultimate goal. Core inflation excludes food and energy prices which are quite volatile to give a deeper, underlying view of inflation.
Truflation, a real-time inflation index, shows inflation at 2.85%, corroborating the decline from the report.

The Fed Funds Rate is currently at 4.25-4.50%. The Fed Funds Rate is the interest rate at which banks lend reserves to each other overnight. It sets the baseline for other interest rates in the financial system
Banks borrow and lend money in the interbank lending market in order to manage liquidity and satisfy regulations such as reserve requirements. The interest rate charged depends on the availability of money in the market, on prevailing rates and on the specific terms of the contract, such as term length.
Source – https://en.wikipedia.org/wiki/Interbank_lending_market
A bank can borrow from the Federal Reserve through the discount window, which helps commercial banks manage short-term liquidity needs. Banks unable to borrow from other banks in the federal funds market may borrow directly from the central bank's discount window and pay the discount rate.
Banks can opt to borrow from other banks. The rate that banks charge each other is known as the federal funds rate. This rate is typically 50 basis points below the discount rate and set by the Federal Open Market Committee (FOMC).5 Commercial banks borrow and lend their excess reserves to each other overnight using this rate. The FOMC meets eight times a year to set the federal funds rate.
Source – https://www.investopedia.com/ask/answers/072815/why-do-commercial-banks-borrow-federal-reserve.asp
The market expects 2 cuts in 2025, which would bring the Fed Funds Rate down to 3.75-4.00% by December 2025.

The bond market has been similarly active. The 10y-2y yield curve un-inverted in October and the divergence has widened since.
Notwithstanding the Fed’s intentions to cut rates, 10y yields have shot higher. The Fed Funds Rate only sets short-term rates. Short-term rates can and do impact long-term rates, but there are many other factors at play over time including the new administration’s policies including tariffs, tax cuts, etc.

The S&P 500 has had very strong performance recently, posting gains of +26% in 2023 and 25% in 2024. These gains beg the question as to where the index stands today in terms of valuation.
From the FastGraph below, the index does currently look to be priced at the higher end, based on the earnings multiple. SPY is currently trading at 25.29x versus a 10-year historical norm of 20.77x.

While the current valuation does look extended, it seems to be supported by expected earnings growth. If growth expectations are realized, the index could produce ~5.5% annualized returns going forward, even if the multiple compresses to 20.77x.
Earnings
Over the last two weeks, one portfolio company reported earnings.

PepsiCo (PEP)

PepsiCo is the well-known, global company behind many popular convenient snacks and beverages, including the brands Lay’s, Doritos, Cheetos, Gatorade, Pepsi-Cola, Mountain Dew, Quaker, and SodaSream.
PepsiCo’s products are consumed more than 1 billion times a day in over 200 countries, generating over $91 billion in revenue.
PepsiCo has a rich history going back more than a century to 1898 when Caleb Bradham first created and sold Brad’s Drink from his drugstore soda fountain in North Carolina. After the initial success, he incorporated the Pepsi-Cola Company in 1902.
In 1932, Lay’s was founded as a potato chip company in Nashville, Tennessee. In the same 1932, Fritos was founded as a corn chip company in San Antonio, Texas. Those two companies eventually merged to form Frito-Lay in 1961.
The current entity, PepsiCo, was formally established in 1965 as a result of the merger between Pepsi-Cola and Frito-Lay.
In 2001, PepsiCo acquired Quaker Oats Company which itself has roots back to 1901. The Quaker Oats acquisition brought a rich portfolio of products including not only Quaker brand products, but also cereals like Cap’n Crunch and Life, as well as beverages including Gatorade and Tropicana.
Today, PepsiCo is a conglomerate of many popular brands, shown below.

The business mix is well diversified, with food making up 59% of sales and beverages the remaining 41%.
The bulk of PepsiCo’s sales are in the United States, representing 57% of sales; the remaining 43% is international.

Although food makes up the majority of the sales, the company is often more closely associated with its namesake product, Pepsi, and therefore closely compared with Coca-Cola Company, which only has beverages.
Pepsi’s beverage products do tend to be the budget-friendly options in the product market spectrum, compared to Coca-Cola’s more premium priced and positioned products.
While the different positioning strategies result in different margin profiles, lower cost products are naturally more resilient during down turns. Consumers can easily trade down to the cheaper option if and when necessary. This low-cost offering is also the reason why large low-cost merchants such as Costco and Taco Bell exclusively offer Pepsi products.
We’ve been on the lookout adding consumer staples, like PepsiCo, to our portfolio. One of the main reasons is to further diversify our portfolio – not just by adding more names, but by finding companies that have different exposures and therefore move differently.
While shares of many technology and growth companies move in tandem, PepsiCo’s performance offers a counterbalance.
During the rate hikes of 2022, the index plummeted. As an example, shares of Amazon and Salesforce both fell close to 50% (49.6% and 47.8%, respectively). Higher rates did not have the same effect on PepsiCo, as the company gained nearly 7% in the same year.
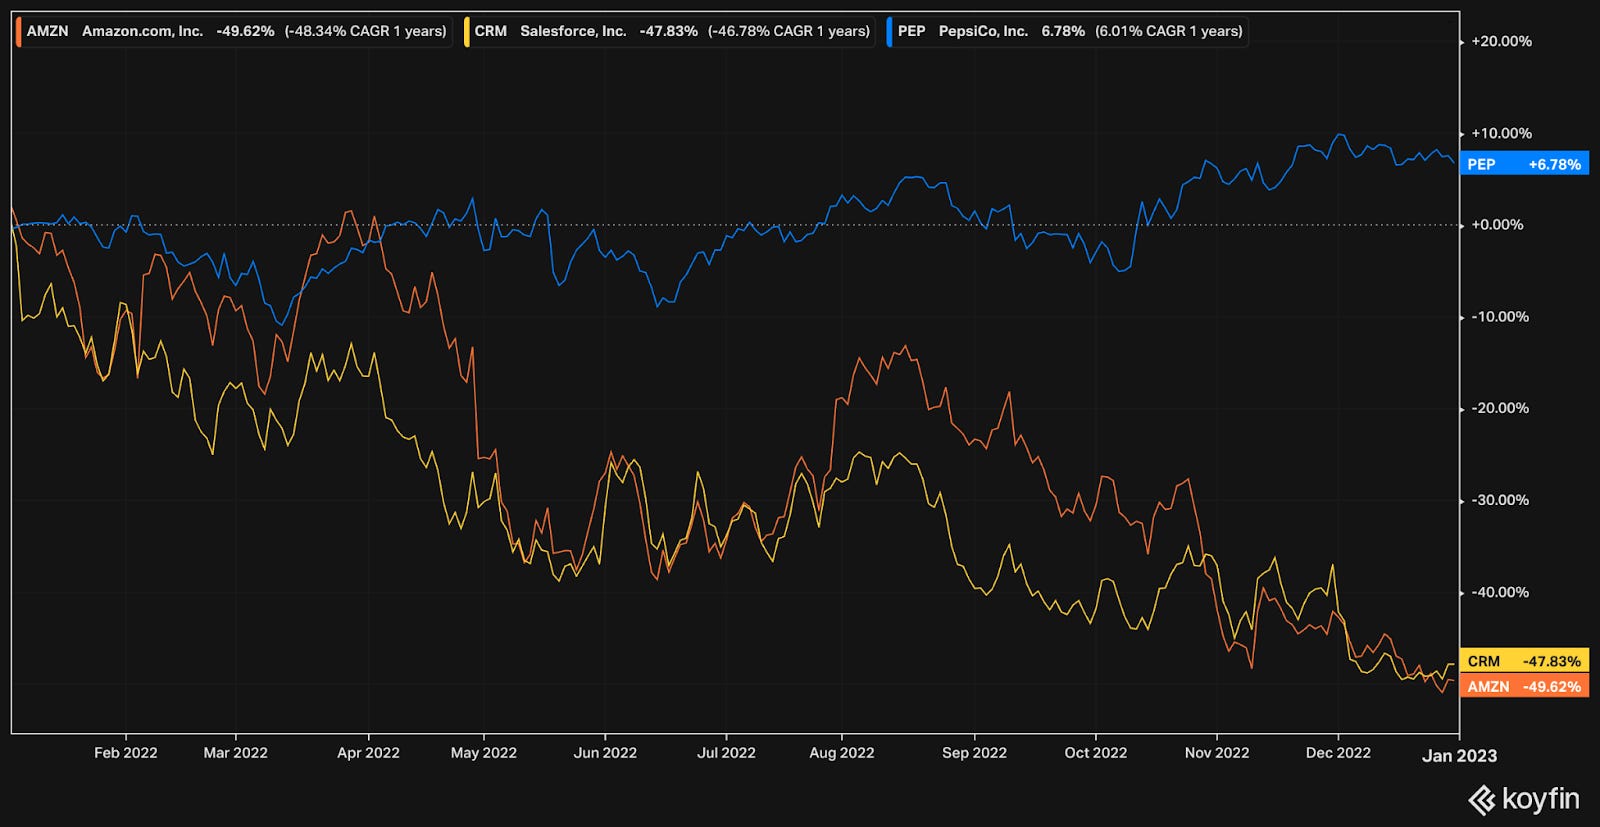
Zooming out further, it is clear that PepsiCo’s shares move quite differently from Amazon and Salesforce. This is a good representation of the broader force of diversification at play, a critical component of a durable, long-term portfolio.

PepsiCo has seen some weakness lately with shares down ~20% from the all time high set in May 2023, as a myriad of concerns are swirling around.
Snacking and beverages are seen as junk food, which contradicts the increasing interest in better-for-you health trends
GLP-1 medications such as Ozempic and Mounjaro are seen to reduce appetite, which could reduce consumption
The new administration selected Robert F. Kennedy (RFK) Jr. to lead the Department of Health and Human Services. He is an outspoken critic of many practices across nutrition and healthcare industries.
Consumption spiked during the COVID pandemic and will need to normalize
Whether due to these concerns or others, sales volumes at PepsiCo have been declining.

After a steady downtrend from +5% growth to -4% decline, volume trends seem to be stabilizing.
PepsiCo is trading at an attractive valuation, and it is in part due to the ongoing concerns. Investors will have to discern the durability and criticality of those concerns for themselves.
As for our take:
Regulation won’t end consumption; in fact it may make it more difficult for new entrants to compete with larger incumbents with more resources.
Healthy trends are important and true, that being said, PepsiCo recognizes that and continues to build its portfolio in that direction with more 0-sugar beverages, healthy snack options, and much more. The recent acquisition of Siete is another important example.
GLP-1, as many new technologies, is getting a lot of attention. It is possible its implications are over-hyped. Estimates show ~6% of adults are taking GLP-1 and that the medication can reduce appetite by 11.7%. That is a ~12% reduction in 6% of the adult population, or 0.72% decrease in adult consumption. For further extrapolation, add kids to the equation at half, then the impact becomes 0.36%. That is spread out across all consumption, not exclusively PepsiCo’s products. Say PepsiCo’s products make up 10% of global consumption (very generous…), then the impact becomes a decline of 0.036%.
All said, we believe that consumer staples are still going to be around. However, we’ll want to see volumes stabilize or turn around before building a more meaningful position.
Diving into the financials:

TTM revenue was flat y/y, a down from +2% growth
TTM gross margin is up to 55%, showing steady increase over time from 53% two years ago
TTM EBITDA margin increased to 19%
TTM FCF margin ticked down to 7%, the low end of its historical 7-10% range
The balance sheet is improving. PepsiCo has 8b in cash, with 38.5b in long term debt.
That results in a 6x leverage ratio against EBITDA. The leverage ratio has come down over time.
Shares outstanding were down 0.2% y/y, and have been steadily coming down over the years
ROIC came in at 17.3%, and has been steady over time in that range
ROIC ex goodwill is 23.8%, showing the company efficiency with ongoing capital requirements
As for valuation:
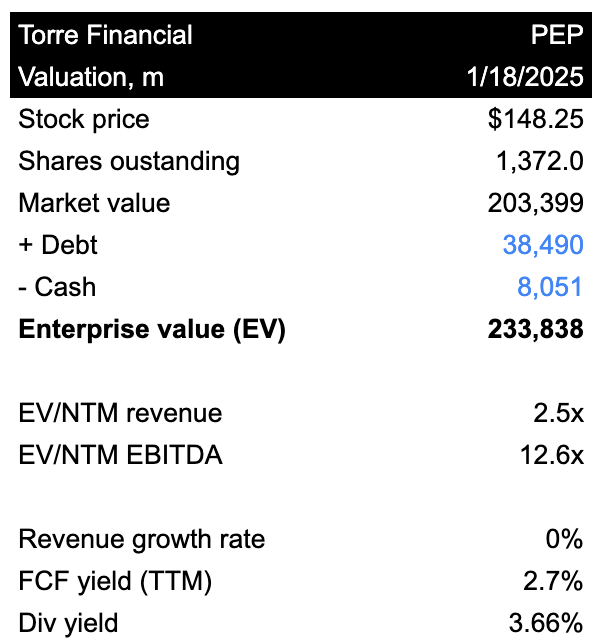
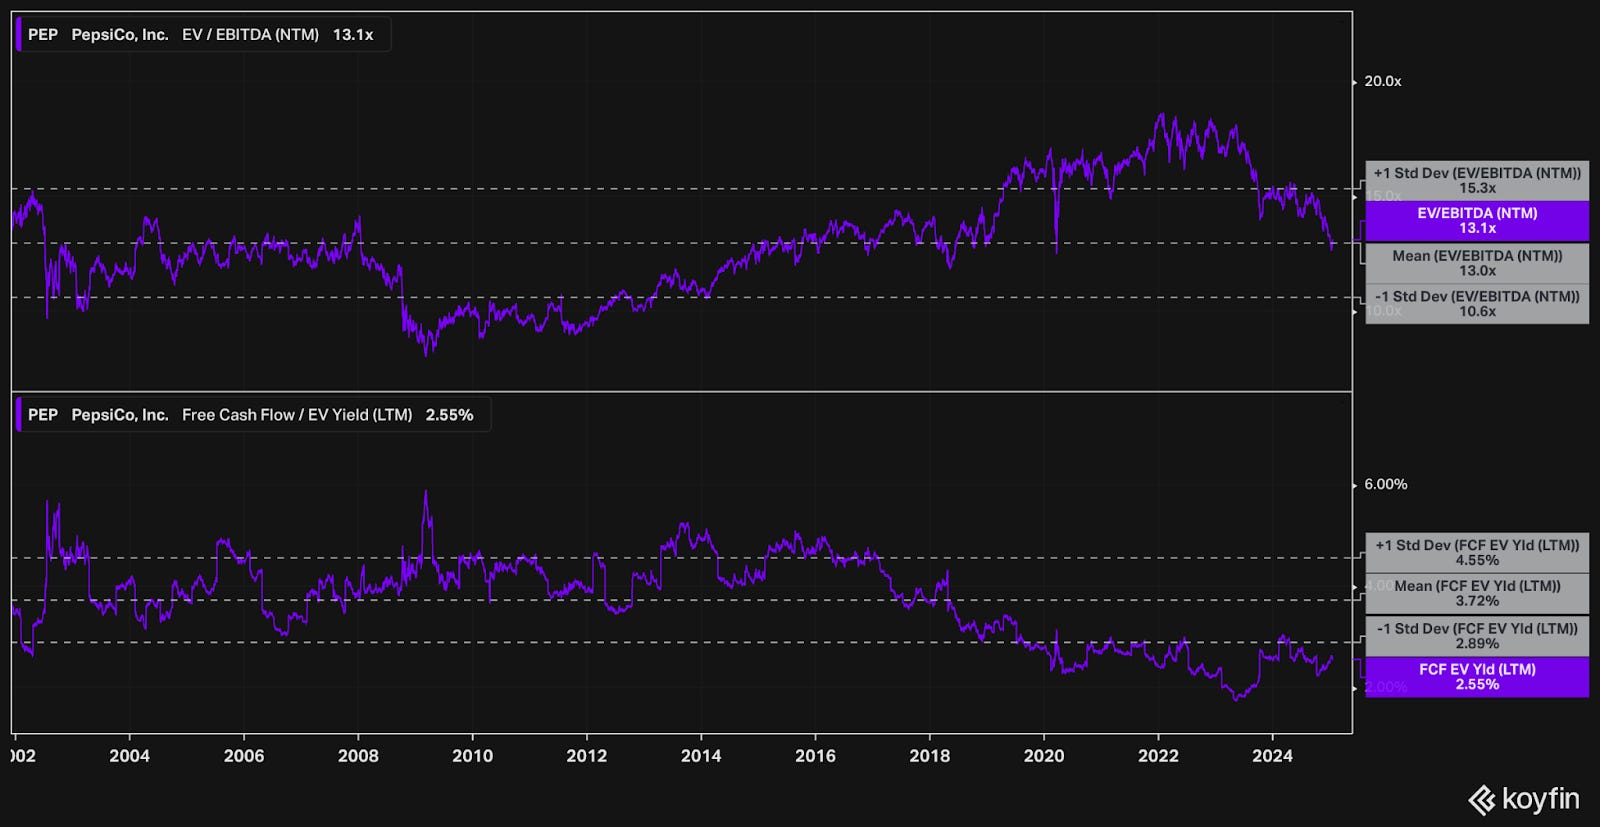
PepsiCo is trading for 12.6x NTM EBITDA. Generally speaking, this is low and quite cheap. Taking the inverse of the multiple shows a 7.9% EBITDA yield.
Going back to 2002, PepsiCo has traded at multiples between 8x (during the 2008 crisis) and 18x (in the post-pandemic boom). The mean over this period is 13.1x. Over the last 10 years, the mean is 15x.
The trailing 12 month’s FCF yield of 2.7% isn’t as cheap looking – it doesn’t corroborate the same cheap picture. We’d like to see the FCF improve. Investors often prefer EBITDA because FCF can be much more volatile.
Looking at the next few years, revenue is expected to grow ~1-4% and EBITDA is expected to grow ~5-7%.

The following table shows possible annualized returns over the next 5 years across various scenarios. The model assumes share count declines by 0.1% each year. Returns include dividends.

Shares in PEP do look like they can generate an attractive return at current prices.
If EBITDA grows at 4% CAGR and multiple trades at 12x, shares could return 7.2% per year
If EBITDA grows at 5% CAGR and multiple trades at 14x, shares could return 11.9% per year
If EBITDA grows at 6% CAGR and multiple trades at 16x, shares could return 16.3% per year
FastGraphs provides another look.

Looking a few years out, if shares were to trade at the historical P/E of 21.76x, shares could produce annualized returns of 16% going forward.
Taking a look at the price action:

PepsiCo shares have been on a steady rise up until mid 2023, when shares plateaued and then dropped sharply in late 2024.
Looking at the volume profile, shares look to have important levels of possible support at $145 and $137. Shares would likely face resistance at ~$163-164.
The relative strength indicator (RSI) was showing shares as being relatively oversold (RSI < 30) in early January. That has since bounced back as shares caught a bid, yet is still in the lower end of the range.
Shares are in a downtrend right now. There may be more volatility ahead before shares stabilize and continue a more steady trajectory.
Investors should weigh all the information including, company’s value proposition, ongoing concerns, fundamentals, and technicals, against their own objectives.
–
Torre Financial is an independent investment advisory firm focused on companies with high return on capital, competitive advantages, and durable growth. Our approach is to stay invested in equities: over time, equities generate the best returns.
Federico Torre
Torre Financial
federico@torrefinancial.com
Disclaimer: This post and the information presented are intended for informational purposes only. The views expressed herein are the author’s alone and do not constitute an offer to sell, or a recommendation to purchase, or a solicitation of an offer to buy, any security, nor a recommendation for any investment product or service. While certain information contained herein has been obtained from sources believed to be reliable, neither the author nor any of his employers or their affiliates have independently verified this information, and its accuracy and completeness cannot be guaranteed. Accordingly, no representation or warranty, express or implied, is made as to, and no reliance should be placed on, the fairness, accuracy, timeliness or completeness of this information. The author and all employers and their affiliated persons assume no liability for this information and no obligation to update the information or analysis contained herein in the future.