


Market, Earnings, & Veeva (VEEV) - August 31, 2024
Market commentary, portfolio company earnings results, and a deeper look into Veeva Systems (VEEV)

Every two weeks we share a review of the market, any earnings results, and a deep dive into one portfolio company. Subscribe now to follow along.
Market
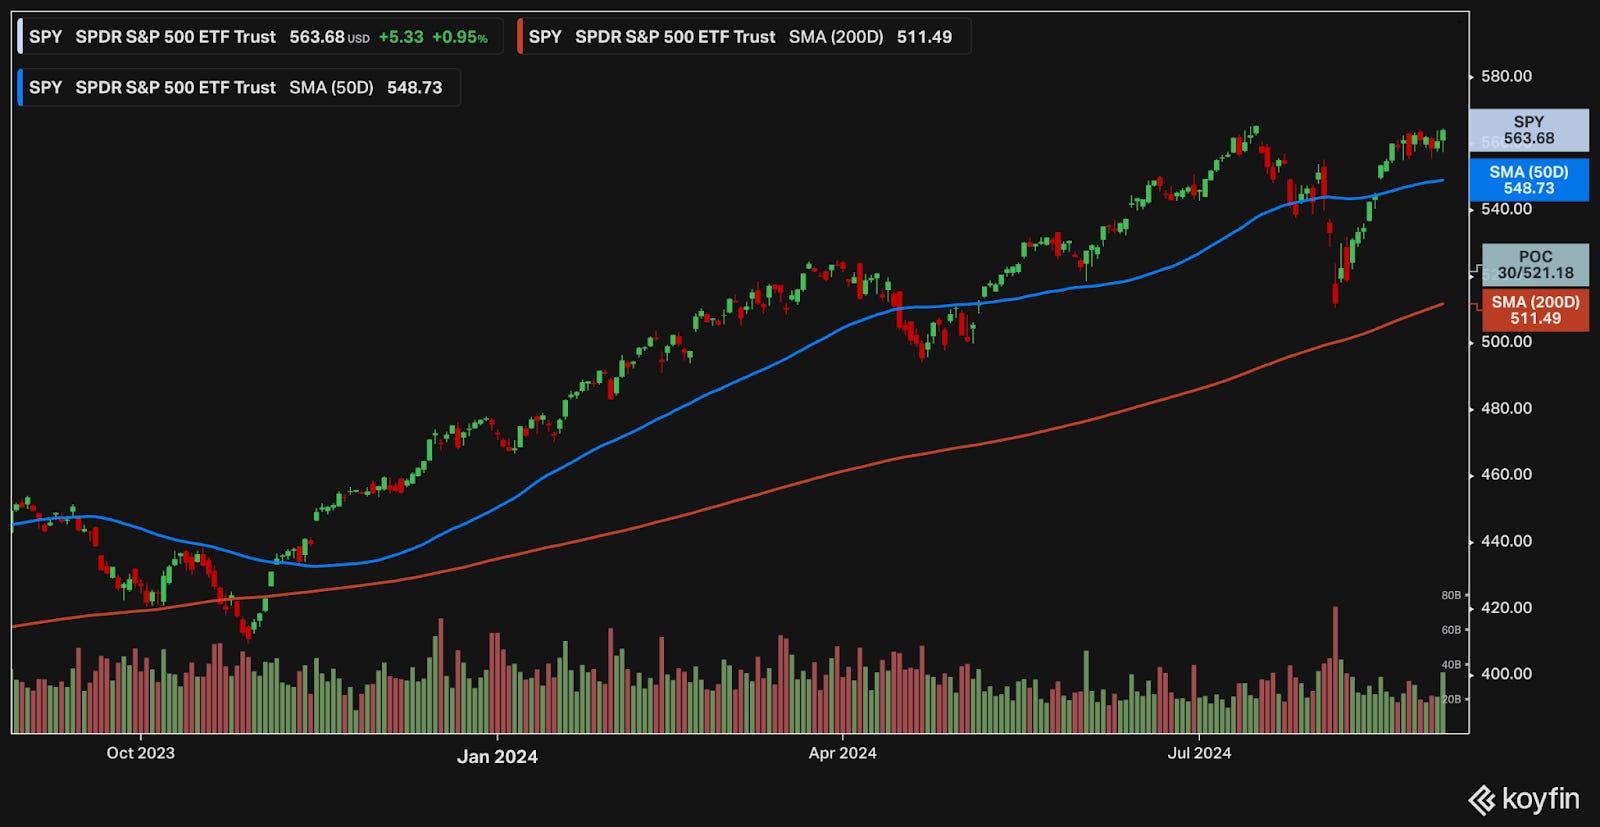
The S&P 500 continues to climb the wall of worry. The bull market ensues as the August sell off is nearly fully recovered. The sharp ascent does, however, appear to be flattening at the top.
Over the last few weeks, the Dow Jones index has been moving up decisively while the Nasdaq has slowed down. This is a sharp contrast to the first half of the year.
Year-to-date performance across indices:
S&P 500 +18.4%
Nasdaq +16.3%
Dow Jones +10.3%

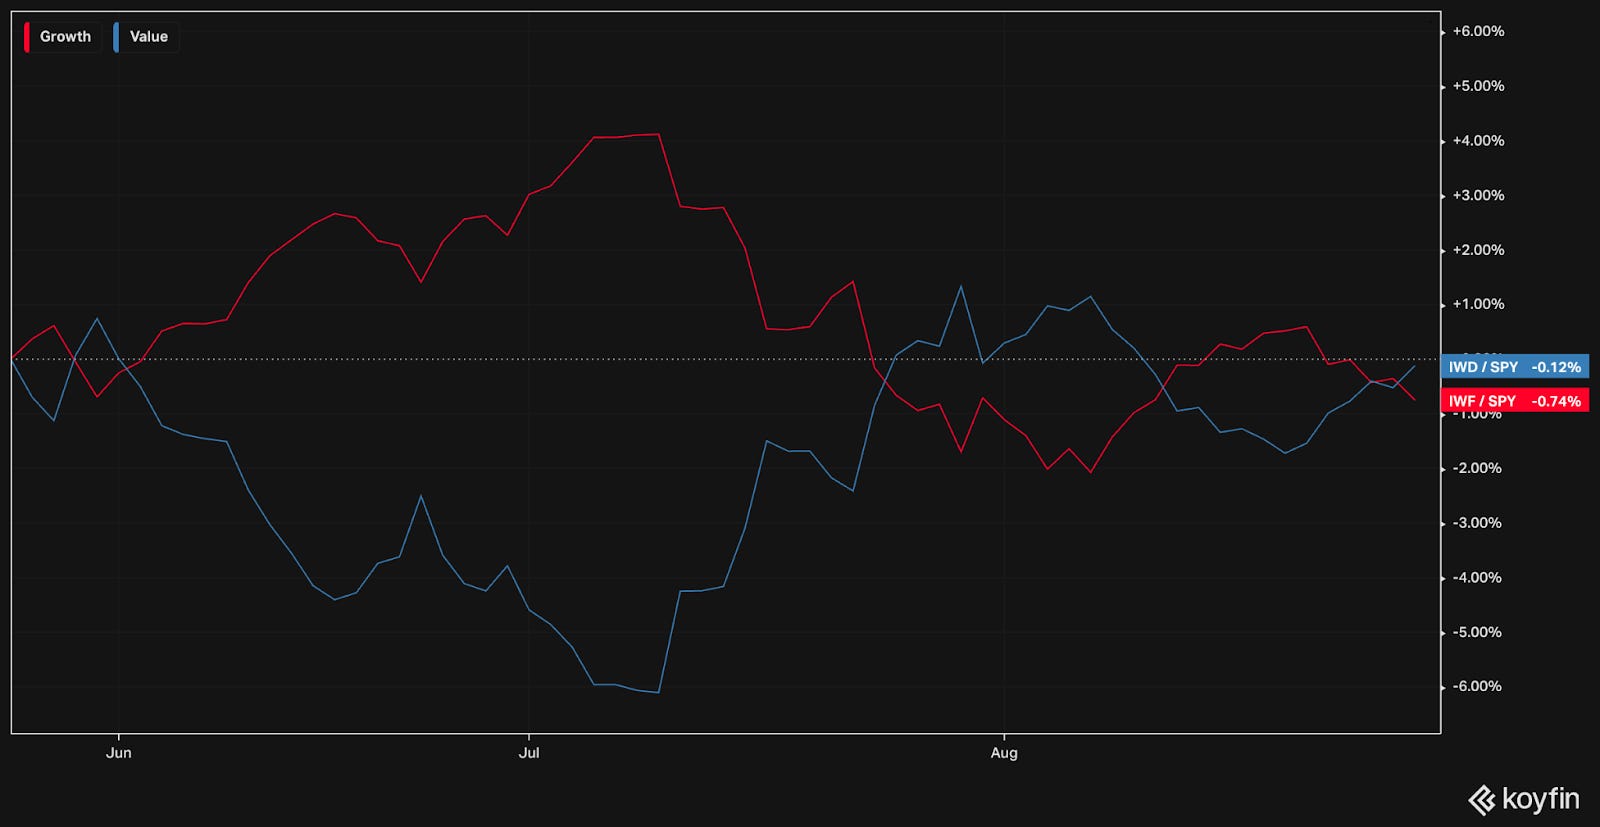
Growth and value continue to trade at a nearly perfect inverse relationship, when normalized by the broader index. In the 2nd half of August growth has slipped while value has picked up.
Performance by sector gives a look at the index undercurrents. Over the last 3 months, Real Estate, notably unscathed by the August drawdown, has emerged as a leader.
Finance, Health Care, Utilities, and Consumer Staples are holding up well.
Energy, Materials, and Technology round out the bottom. This is yet another sign of an apparent rotation out of technology.

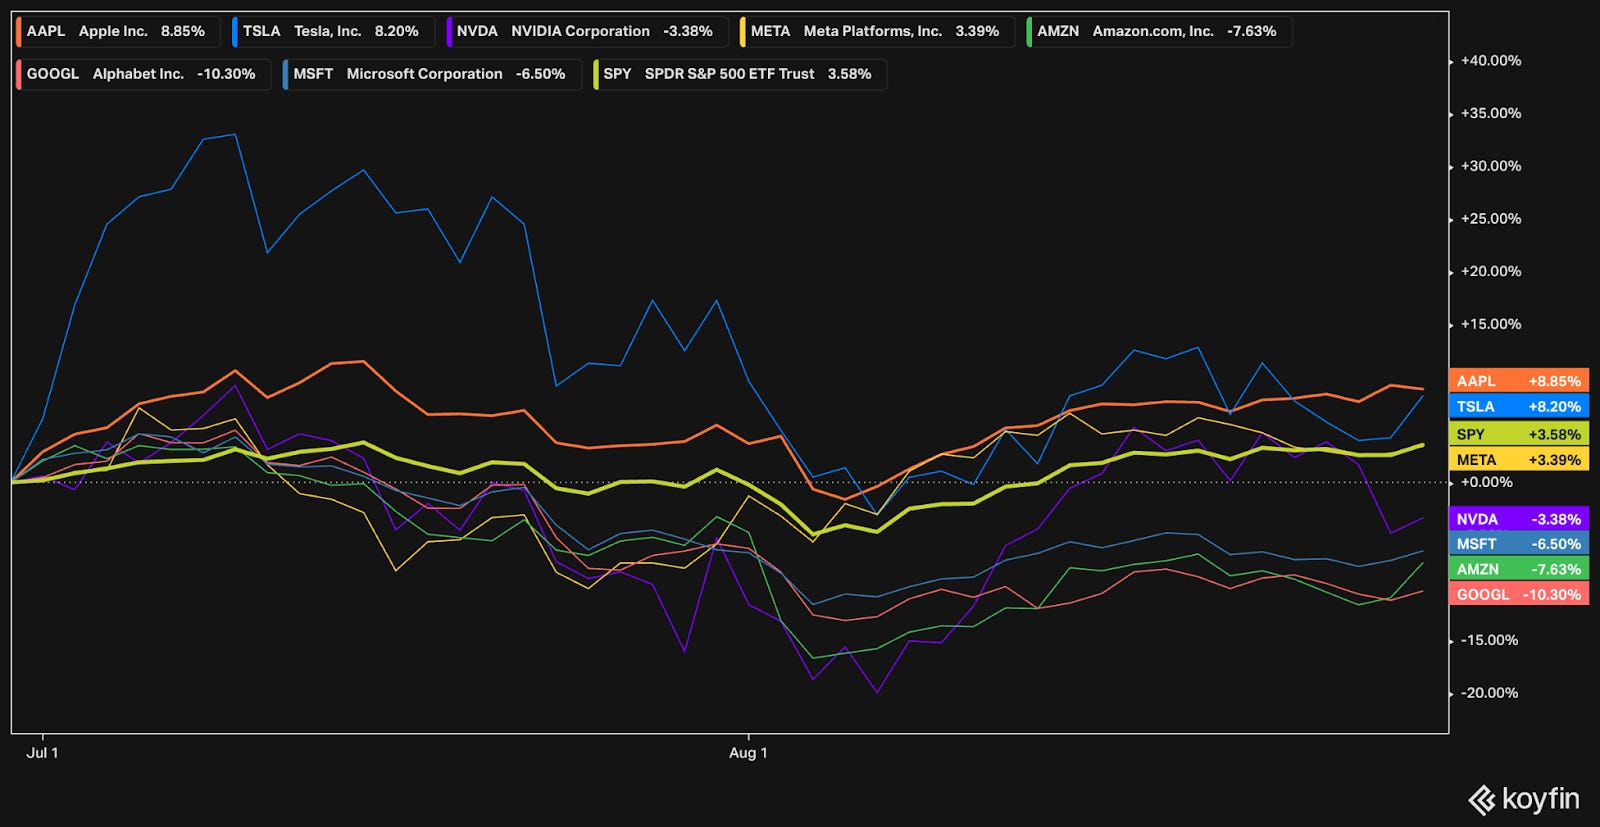
Having taken the market higher in the first half, the Magnificent 7 have generally slowed down. Other companies are starting to contribute to the S&P 500’s performance.
Since July 1st, the SPY is +3.6% while:
Google -10.3%
Microsoft -6.5%
Amazon -7.6%
Nvidia -3.38%
Tesla +8.2%
Apple +8.9%
Inflation has been slowing and the employment market is softening. Jerome Powell delivered a speech in Jackson Hole, clearly stating the pivot in the Fed’s policy. The time for cuts is here – the magnitude and timing to be determined.
The market expects rates to come down nearly a full percentage point by the end of the year, to 4.36% from the current 5.33%. By the end of 2025, the market expects another full point, taking the rate down to 3.28%.

Talk and worry of a pending recession continue. One day it will come, but there’s little to be gained by waiting on the sidelines.
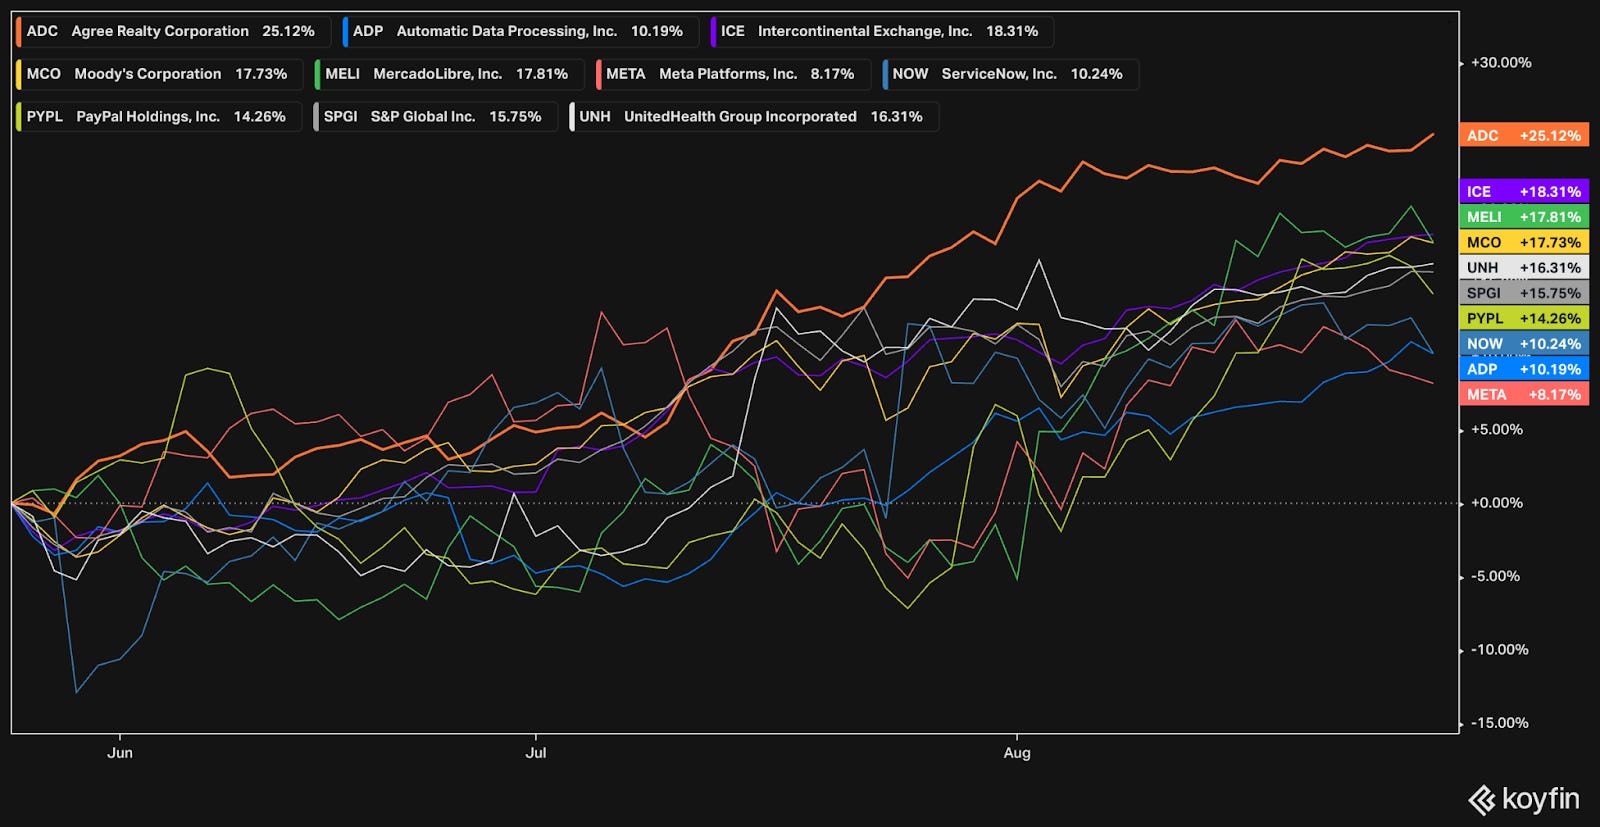
Our portfolio companies and many other companies are doing very well. We’ve had multiple portfolio companies hit new 52-week and all time highs within the last couple of weeks, including ADC, ADP, ICE, MCO, MELI, META, NOW, PYPL, SPGI, UNH.
Earnings
Over the last two weeks, 4 portfolio companies reported earnings.

Veeva Systems (VEEV)

Peter Gassner left Salesforce in 2005 and pioneered the life science industry cloud category with Veeva in 2007 with a strong belief that vertical cloud software would be the next wave of cloud innovation. He’s been the CEO ever since.
Veeva offers cloud software, data, and business consulting services to the largest life sciences companies, helping them with everything from research & development through commercialization.
Customers span across pharmaceutical, biotechnology, and medical device companies, contract sales organizations, and contract research organizations and include some of the largest global companies such as Bayer, Eli Lilly, Gilead Sciences, Merck., and Novartis, as well as emerging growth companies.
Veeva’s solutions help life sciences companies develop and bring products to market faster and more efficiently, market and sell more effectively, and maintain compliance with government regulations.
The business is organized around those three pillars:
Veeva Development Cloud - applications to help run clinical trials, coordinate with contract research organizations, keep electronic records, manage quality content, and much more
Veeva Commercial Cloud - software and analytics to help commercialize products, including customer relationship management (CRM), database of validated medical content, digital asset management solution for managing promotional material, solutions to maximize marketing effectiveness
Veeva Data Cloud - data platform of reference data, deep data, and transaction data; such as customer data including demographics, speciality, affiliations; database of key people, publications, conferences; database of de-identified longitudinal patient and projected prescriber data that can be used for planning, patient finding, journey analytics, incentive compensation, and more

Veeva is central to their customer’s operations and becomes more deeply integrated over time. It is the connectivity tissue throughout the drug development phase and similarly throughout the commercialization phase.
Veeva has taken a more prudent wait-and-see approach with AI, enabling customers to plug in their own AI solutions to work with Veeva. That being said, the criticality of their data sets coupled with the data cloud offering sets them up well to be a core partner.
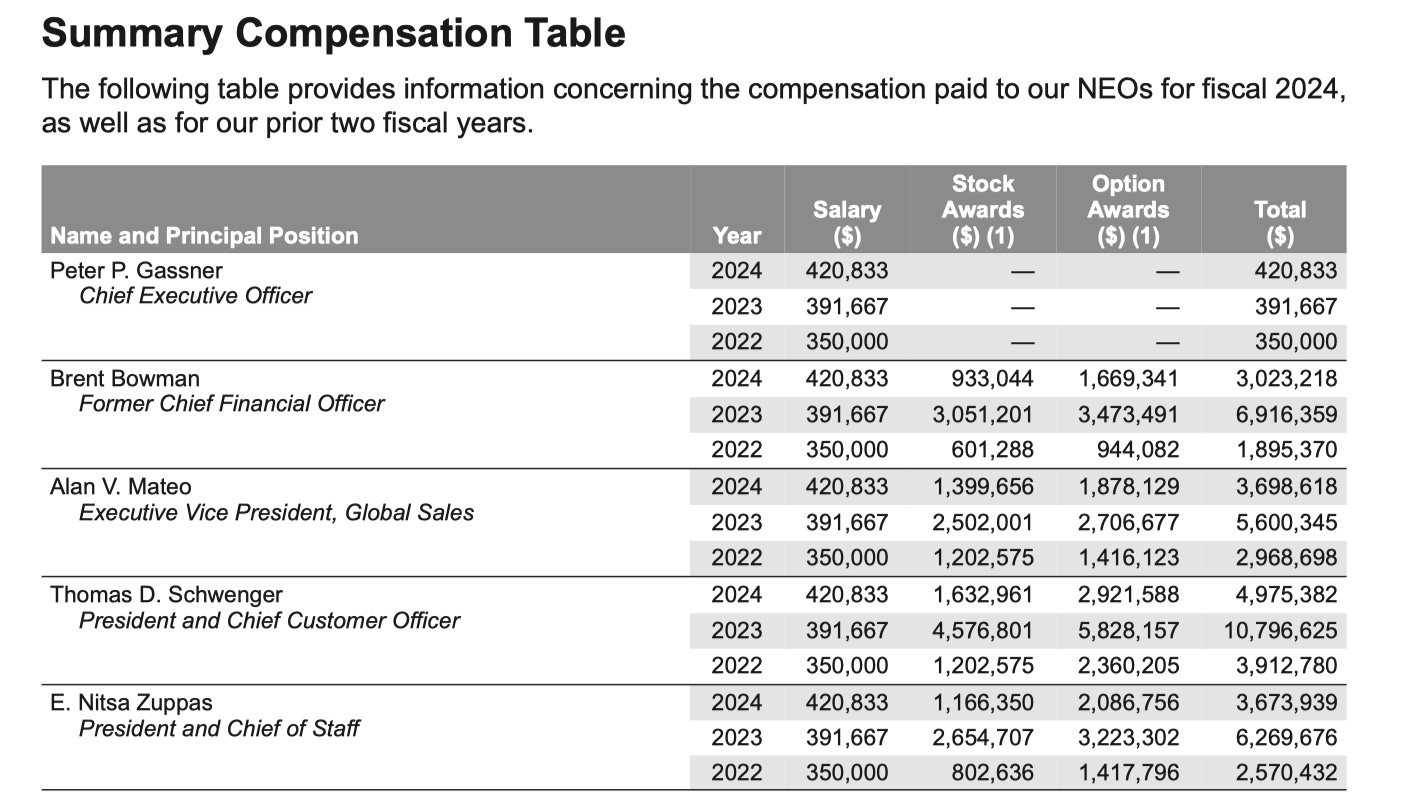
Peter Gassner has proven to be a strong founder, leader, and manager. Approximately 10% of the company is held by insiders, with Peter Gassner owning over 7.5%. His stake comes to over $2.6 billion given the current market cap of ~35 billion.
His compensation plan is structured for long-term incentives, with ad-hoc equity plans. His most recent equity plan was set in 2018 - an equity package that vested over 7 years with a 2 year cliff. Before that, his most recent equity plan was set in 2013 shortly after the IPO.

Given the success of the company since 2018, his vested options are now worth over $350 million.
Aside from his long-term equity incentive plan, Peter Gassner makes a modest CEO salary of roughly $420,000. Other executives do have more regular annual stock incentive plans alongside salary, generally making between $3-5 million each.
Veeva has continued to innovate. Starting with the CRM offering, they have developed a host of new offerings that are just starting to mature.

By connecting software and data for these companies, Veeva is well positioned as an integral partner.
Veeva has been a well-run company since the beginning, always balancing growth and profitability. They’ve consistently hit their long-term revenue goals.

GAAP net income has been positive since IPO. Free cash flow has always come in above net income.

Diving into the financials:

TTM revenue growth accelerated to 15%. The company has made some recent changes to contracts that affected revenue recognition (“standardizing termination for convenience rights,” as more orders are now multi-year in duration) – that accounting headwind is now behind them.
Gross margin is strong and increasing at 73%
EBITDA margin (without adding back stock based compensation) came in at 24%. With stock based compensation, the adjusted EBITDA margin is 40%. Even though it is non-cash, stock-based compensation is an ongoing cost, so it should be considered an expense.
FCF margins ticked lower at 38%. There seems to be some pretty wide variance on FCF margins, likely due to timing of large customer payments.
The balance sheet is strong. Veeva has 0 debt and the cash balance continues to increase, now at over $4.8 billion!
Shares outstanding are increasing by 0.6% y/y, although at a slower pace than in the past. This has spiked up to 3.5% y/y, which is quite high. That being said, the company has maintained profitability in spite of it.
On efficiency, ROIC metrics are strong in the ~20-22% range. Goodwill is backed out, since it is not an ongoing capital requirement. Notably, goodwill is rather low for Veeva. They have been able to grow organically, which is a strong plus.
As for valuation:

Valuation seems very reasonable, if not attractive.
Enterprise value is just over $30 billion. EV/NTM EBITDA of 25.7x is not expensive for a high quality company with such a long runway. Veeva currently goes for a TTM FCF yield of 3.2%, with revenue growth 15%.
Over the last 10 years, Veeva traded at multiple of 37.5x on average. The average FCF yield has been 2.3%.

Looking forward, sales are expected to grow ~12-14% per year over the next few years.

EBITDA is expected to grow more quickly at a ~14-15% CAGR.

The following table shows possible annualized returns over the next 5 years across various scenarios. The model assumes annual share dilution of 1%.

With some multiple compression and moderate EBITDA growth, shares could return 10-12% per year.
If the multiple expands slightly and EBITDA grows slightly faster, shares could return 13-15% per year.
Fastgraphs provides another look.

If shares were to maintain the current blended P/E multiple of 38.38x, VEEV could trade up to $290 in a few years, yielding annualized returns of 12.8%.
Taking a look at the price action:

Shares have been trying to pick up momentum since early 2023. After a rapid ascent in 2024, shares gave up nearly all the gains. On the back of a strong earnings release, shares jumped up near the 52-week high.
While shares are trading above the 200-day and 50-day moving average, the 50-day SMA trend line is below the 200-day line. If the price is able to hold, momentum will strengthen as the 50-day SMA trend crosses above the 200-day line.
The 14-day relative strength index (RSI) is showing shares are likely overbought in the short term. Expect some consolidation.
Veeva shares are sitting on top of a volume shelf. This is a critical juncture at the ~216 level. It can very well present some resistance, yet once the price overcomes this shelf it is likely to move higher.
–
Torre Financial is an independent investment advisory firm focused on companies with high return on capital, competitive advantages, and durable growth. Our approach is to stay invested in equities: over time, equities generate the best returns.
Federico Torre
Torre Financial
federico@torrefinancial.com
Disclaimer: This post and the information presented are intended for informational purposes only. The views expressed herein are the author’s alone and do not constitute an offer to sell, or a recommendation to purchase, or a solicitation of an offer to buy, any security, nor a recommendation for any investment product or service. While certain information contained herein has been obtained from sources believed to be reliable, neither the author nor any of his employers or their affiliates have independently verified this information, and its accuracy and completeness cannot be guaranteed. Accordingly, no representation or warranty, express or implied, is made as to, and no reliance should be placed on, the fairness, accuracy, timeliness or completeness of this information. The author and all employers and their affiliated persons assume no liability for this information and no obligation to update the information or analysis contained herein in the future.