


Market, Earnings, & Veeva (VEEV) - June 7, 2025
Market commentary, portfolio company earnings results, and a deeper look into Veeva (VEEV)

Every two weeks we share a review of the market, any earnings results, and a deep dive into one portfolio company. Subscribe now to follow along.
Market

The S&P 500 continues to build momentum. After bouncing off the 200-day moving average, SPY notched another local high, overcoming the $596 level that presented resistance in late May.
The index is above both its 50-day and 200-day moving averages. The market is 6% higher than it was on April 2nd, when the tariffs were announced, and within 2% of a new all-time-high.
Year-to-date performance across indices:
S&P 500 +2.00%
Nasdaq +3.52%
Dow Jones +0.51%
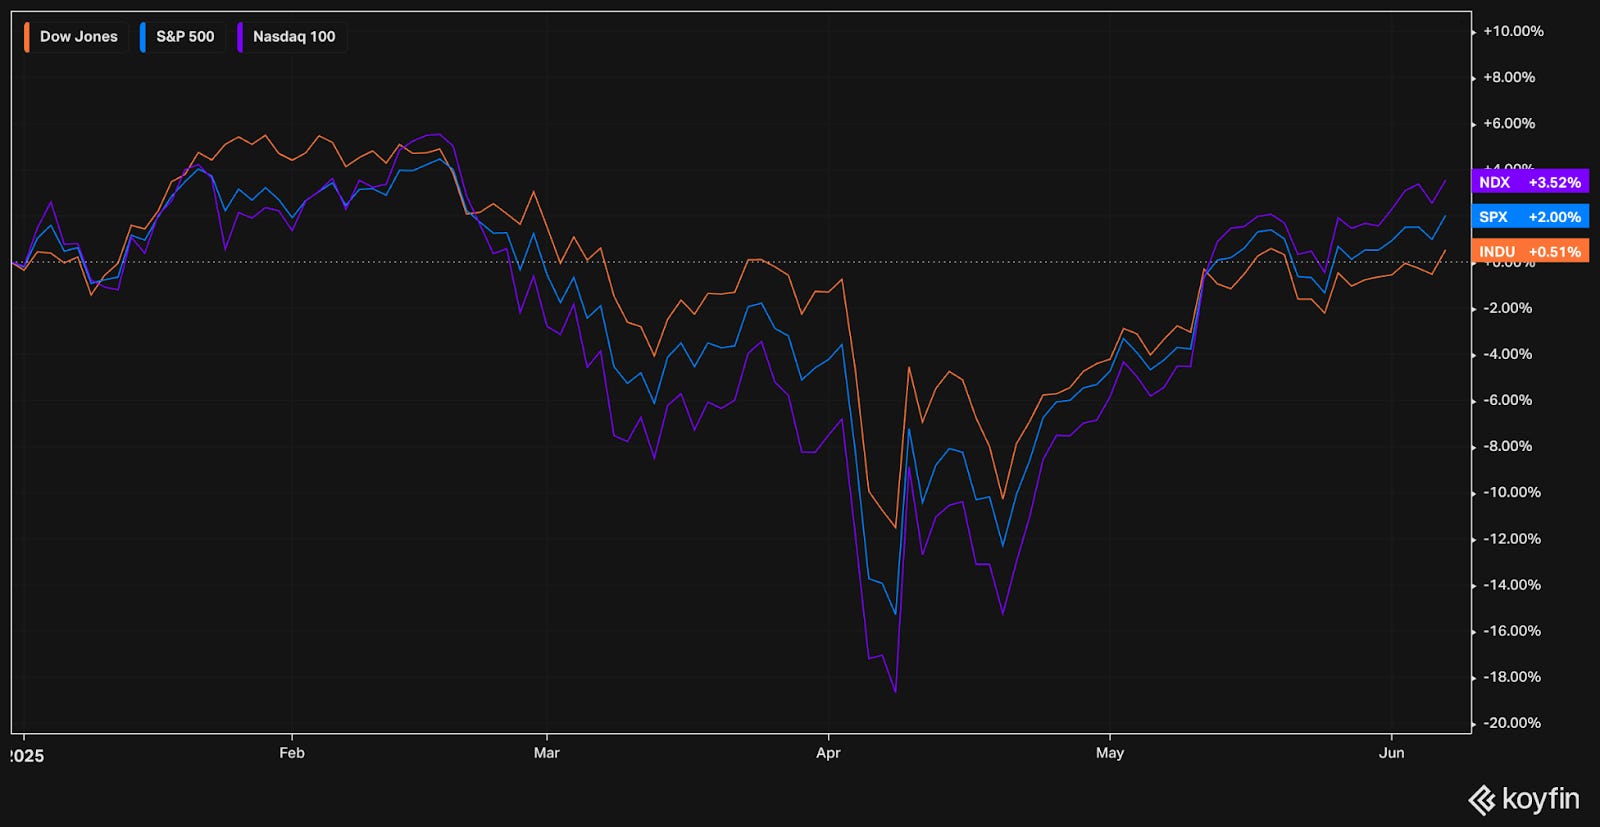
The S&P 500 had its best performance for May in the last 35 years as the index gained 6.3% for the month. Buyers seem to be coming back, with a strong appetite for risk.
Since April 2nd, growth has handily outperformed with a gain of nearly 11%, compared to 1% for value and 6% for the S&P 500.

Technology, industrials, consumer discretionary, and communications have been leading the charge. Healthcare and energy have been lagging behind significantly.

Healthcare is typically a defensive sector that is resilient to economic weakness, yet is currently under pressure from multiple angles, particularly facing:
Company specific issues, for example failed drug trials for Regeneron; declining COVID related sales for Moderna; increased costs and scrutiny for United Healthcare; and more
Government policy, including reduced & eliminated research budgets, medicaid reductions, Inflation Reduction Act taking effect in January 2026, pharmaceutical price negotiations
The regulatory environment and related public opinion on rising healthcare costs are significant headwinds. That being said, there are strong secular tailwinds: aging global population and rising chronic disease.
Volatility seems to have subsided as the VIX continues to stabilize. The VIX index measures the demand for portfolio protection, via purchases of 30+ day put options.

Markets like certainty and stability. When the VIX is low, equities tend to outperform.
During periods of low VIX, equities outperformed bonds by over 8%
During periods of medium or high VIX, equities outperformed bonds by only 3-4%
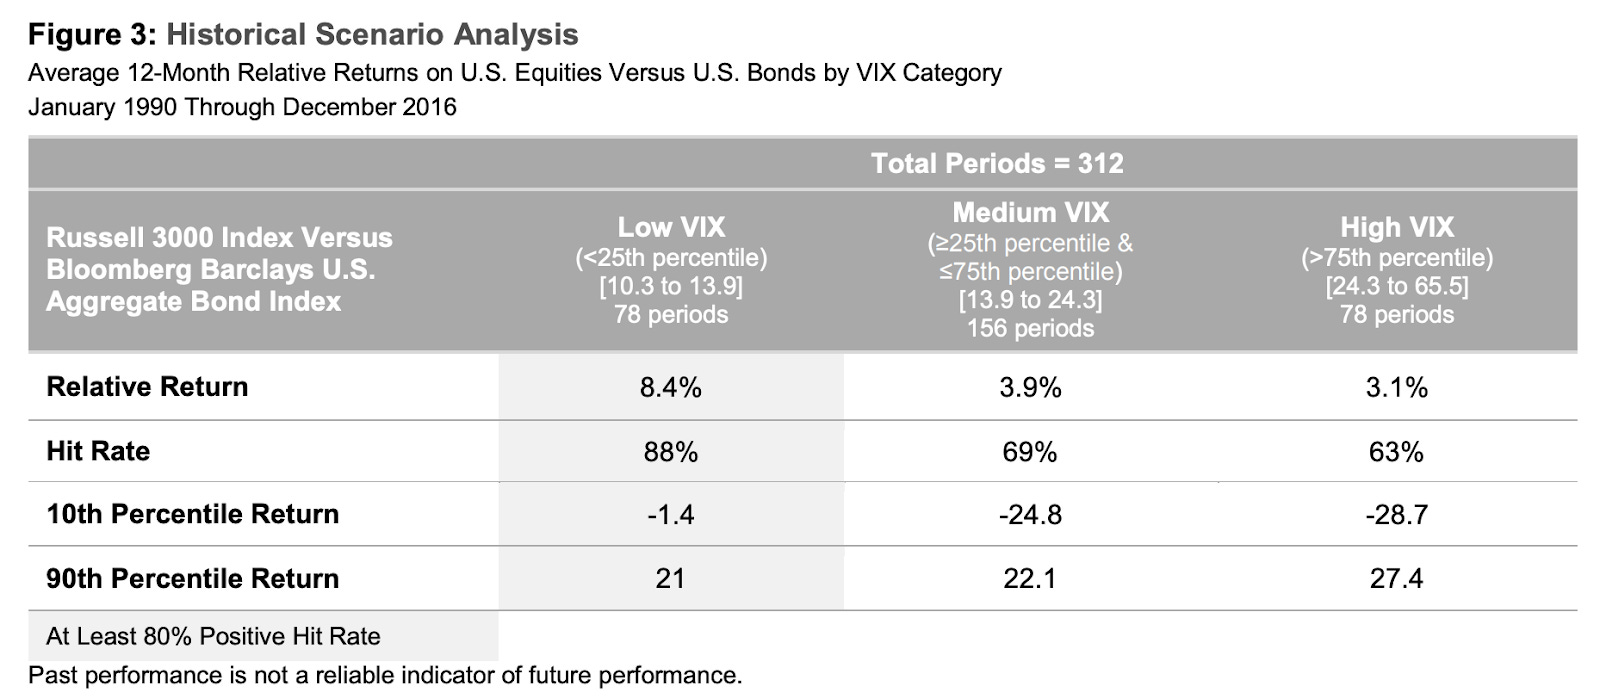
Source: What does a low VIX tell us about the market, T. Rowe Price
Money supply has been moving up since January 2024 and accelerated since January 2025. This is a significant shift from the tightening measures from 2022 through 2024.
The money supply is an important factor in the value of all assets. Simply considering supply and demand dynamics – the more money available, the higher the demand for assets, the higher the prices.

The job market remains healthy. There continue to be more job openings than unemployed people, although the gap is narrowing. Someone in the labor force is defined as unemployed if they are available for work and made at least one active effort to find a job during the 4-week survey period.

Inflation continues to decline, with CPI down to +2.3% year-over-year.

Although it’s been bumpy, yields have been trending lower in 2025. The 2-year yield (3.86%) is down 9% YTD, while the 10-year yield (4.34%) is down 5% YTD.
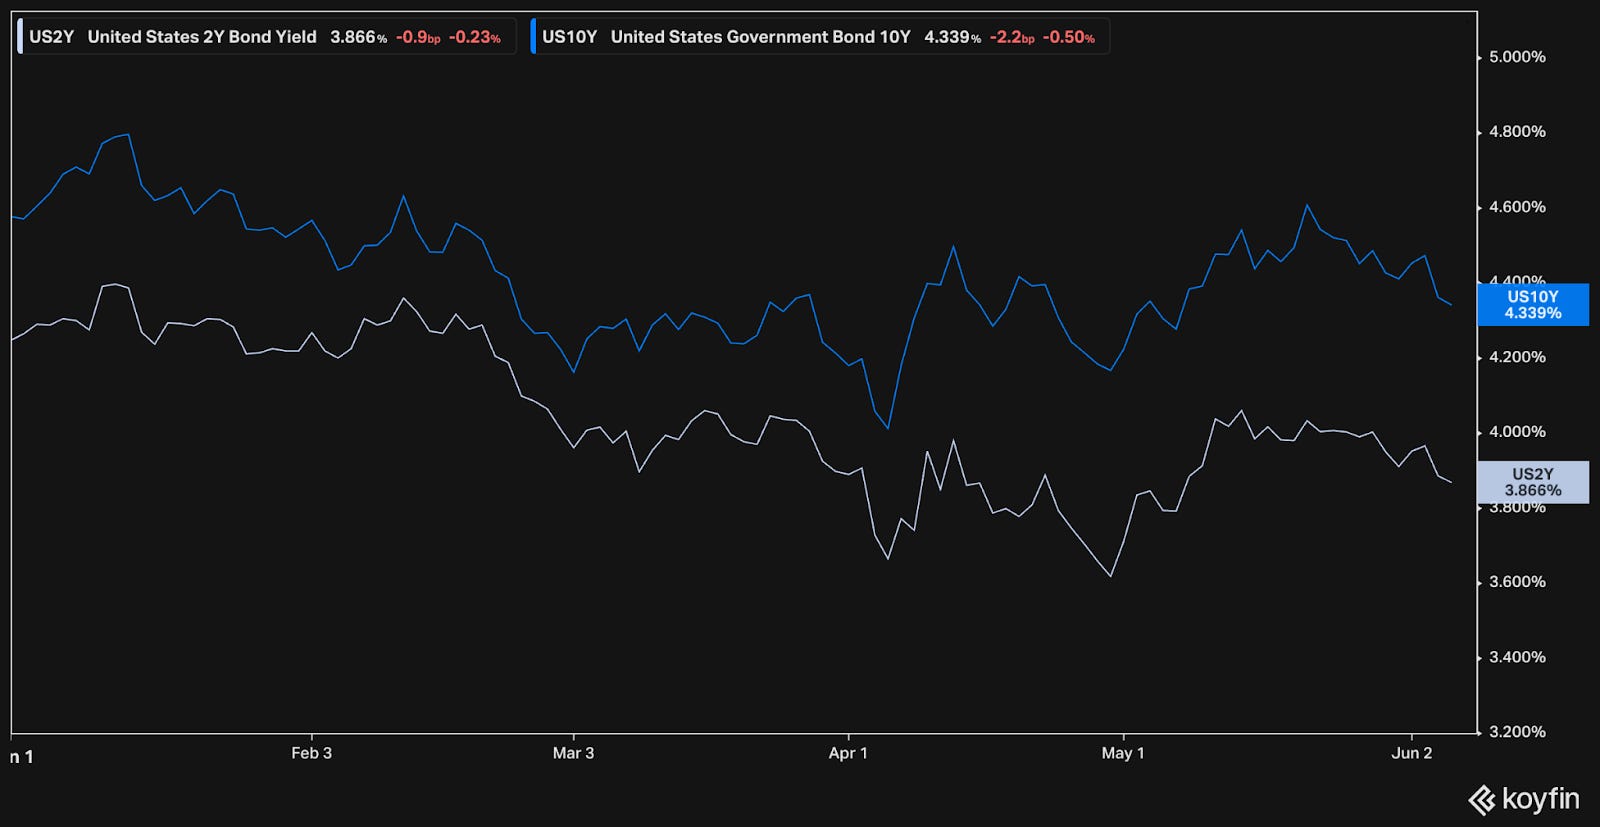
Long term rates are determined by the market and involve a multitude of factors including GDP growth, relative currency strength, long term inflation levels, etc.
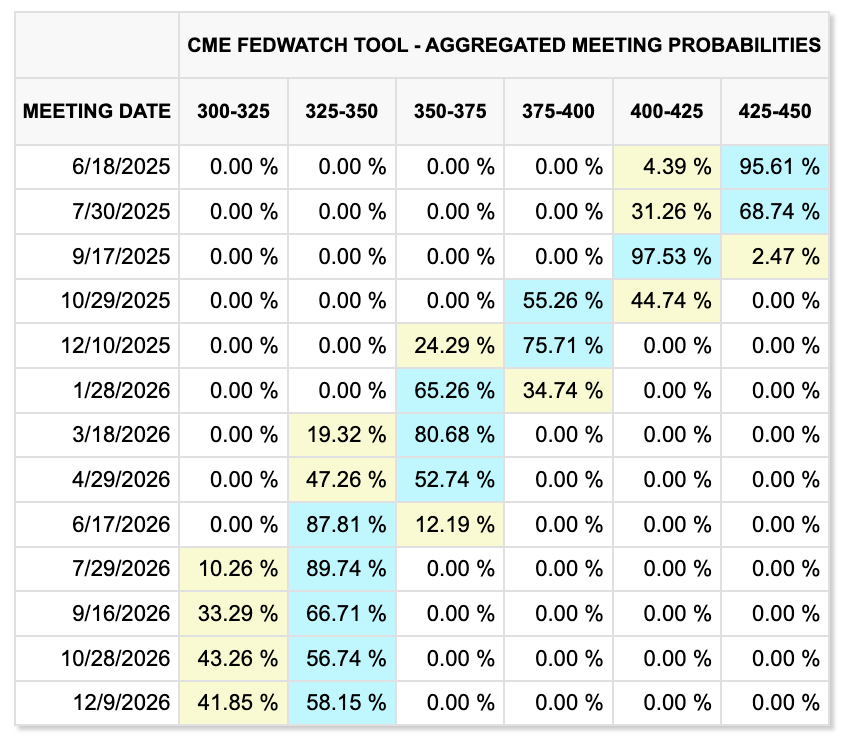
Short term rates are driven by the Fed & the Fed Funds Rate, which is currently at 4.25-4.50%.
The market continues to expect 2 rate cuts for 2025, in September and December, which would bring the Fed Funds Rate down to 3.75-4.00%.
Earnings
Over the last two weeks, 2 portfolio companies reported earnings.

Veeva Systems (VEEV)

Prior coverage:
Veeva is building the industry cloud for life sciences and the healthcare industry. They focus on software, data, and business consulting for research & development, quality, and commercial use cases. For more background, see prior coverage linked above.
On May 28th, the company released their Q1 earnings for fiscal year 2026. The market reacted very positively. Shares jumped +8% the next day, even as the S&P 500 and Nasdaq were both roughly -1%. CEO Peter Gassner called it their “best first quarter ever.”
Veeva continues to execute very well. Revenue increased 17% year-over-year. GAAP EPS was up 40% to $1.37, compared to $0.98 a year earlier.
In April, they achieved their $3 billion revenue run rate goal they had set for 2025. They reiterated they are on track for their 2030 goal of $6 billion.
Veeva had been cautious in jumping into AI offerings, initially opting to enable other solutions on their platform. This quarter they announced their plans to build AI agents and Shortcuts into their core applications to drive productivity.
Diving into recent financials:

TTM revenue growth ticked down to 15% y/y, although the quarter was strong with +17% y/y
TTM gross margin came in at 75%, a tribute to their pricing power & the criticality of their services
TTM EBITDA margin improved to 28%. There’s been a steady trend higher over the last 2 years
TTM FCF margin was 42% for the quarter; ex-stock-based compensation, the adjusted FCF margin comes down to 26%. Although SBC is significant, the company is still generously profitable
The balance sheet is pristine – no debt and over $6 billion in cash. Cash has been growing every quarter.
Shares outstanding increased 1.1% y/y, primarily due to stock-based compensation
On efficiency, ROIC is 10%. This is on the lower end of our portfolio companies. Veeva is very much in investment and growth mode. FCF ROIC is 19.4%, due to adding back SBC.
ROIC ex goodwill is right around the same level, 11%. Goodwill is very low. Veeva has not been highly acquisitive. Rather, they have primarily developed their applications and solutions in house. This organic development and growth is an important strength.
As for valuation:

Shares currently trade for 28.6x EV/NTM EBITDA and a FCF yield of 2.9%. Given Veeva’s long runway, proven execution, and differentiated offering, 28-30x seems like a fair range.
The current valuation is favorable compared to the 10-year historical means of 37x EV/NTM EBITDA and 2.4% FCF yield.
Analysts expect the company to continue to grow. Sales are expected to grow at ~13% CAGR, with EBITDA growing slightly faster at ~17% CAGR.

Looking out over the next 5 years, considering various EBITDA growth rates and exit multiples, we can analyze possible annualized returns across possible scenarios.

If EBITDA grows at 14% CAGR and the multiple compresses to 26x, shares could return 9.5% per year
If EBITDA grows at 16% CAGR and the multiple expands slightly to 30x, shares could return 14% per year
Fastgraphs provides another look:

If the current P/E multiple (40.80x) were to be maintained over the next few years, shares could return over 12% per year.
The current multiple seems reasonable, as Veeva shares have traded above it for all of 2014-2022. Over the last few years, shares have see-sawed right around that 40x multiple.
Given the recent & dramatic jump in share price, Veeva shares may seem relatively pricey. Anchoring Bias can easily come into play. As investors it is important to overcome such biases and remember to look to the future to assess expected outcomes. Although shares are relatively more expensive today, Veeva still offers an attractive outlook.
–
Torre Financial is an independent investment advisory firm focused on companies with high return on capital, competitive advantages, and durable growth. Our approach is to stay invested in equities: over time, equities generate the best returns.
Federico Torre
Torre Financial
federico@torrefinancial.com
Disclaimer: This post and the information presented are intended for informational purposes only. The views expressed herein are the author’s alone and do not constitute an offer to sell, or a recommendation to purchase, or a solicitation of an offer to buy, any security, nor a recommendation for any investment product or service. While certain information contained herein has been obtained from sources believed to be reliable, neither the author nor any of his employers or their affiliates have independently verified this information, and its accuracy and completeness cannot be guaranteed. Accordingly, no representation or warranty, express or implied, is made as to, and no reliance should be placed on, the fairness, accuracy, timeliness or completeness of this information. The author and all employers and their affiliated persons assume no liability for this information and no obligation to update the information or analysis contained herein in the future.